Occamy against Guacamole
The comparison benchmark's results in bench-essential.json, as bench/report.py analyses them: each series' median of every metric in each scenario and network, the improvement of one series over the other, and whether the difference is significant.
How Occamy is measured describes the scenarios, the networks and the metrics, and Analysis the statistics, which were fixed before any data was collected.
The run
- Started at 2026-11-03T20:47:56.02838Z, on Apple M5 Pro (18 CPUs, darwin), with podman version 6.0.2.
- 6 runs with seed 20261102; each scenario that measures a key's latency timed 100 keys a run.
- Before each result, the harness waited until the host's 1-minute load average was below 8.
- 192 results analysed, and 0 failed.
- The series are Guacamole and Occamy; Run a comparison gives each one's name in the results files.
How to read this report
Each value is the median of the runs, followed by its 95% interval in brackets: an exact interval from order statistics, which assumes nothing about how the values are distributed.
Improvement is the baseline's value divided by the candidate's, or the candidate's divided by the baseline's for a metric where higher is better, such as frames shown a second. Above 1×, the candidate is better: 3× is a third of the baseline's latency, or three times its frames. It's the Hodges–Lehmann estimate of that ratio, with its exact 95% interval from the Mann–Whitney distribution.
p is the exact two-sided permutation test of the rank sum, over every split of the runs. Each scenario's primary metric is the one its comparison is judged on. p (Holm) corrects the primary metrics' p-values with Holm's method, and a difference is significant where it's below 0.05. The other metrics, the secondary ones, are exploratory, and their p-values aren't corrected.
Primary metrics
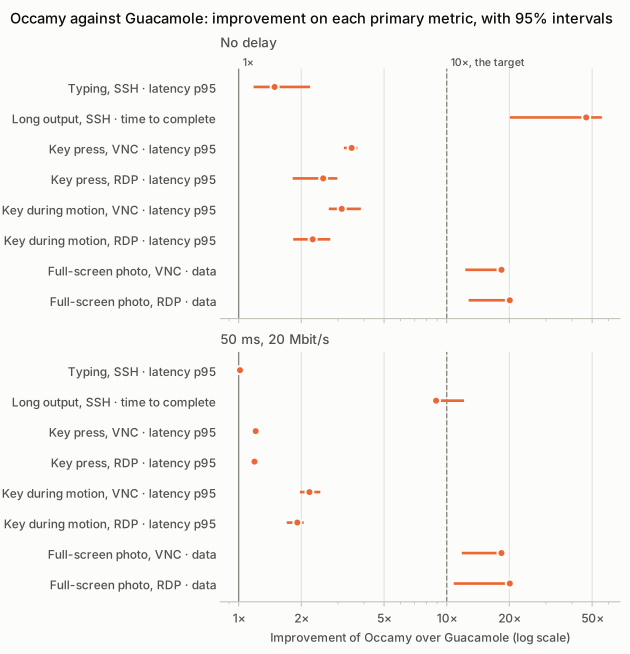
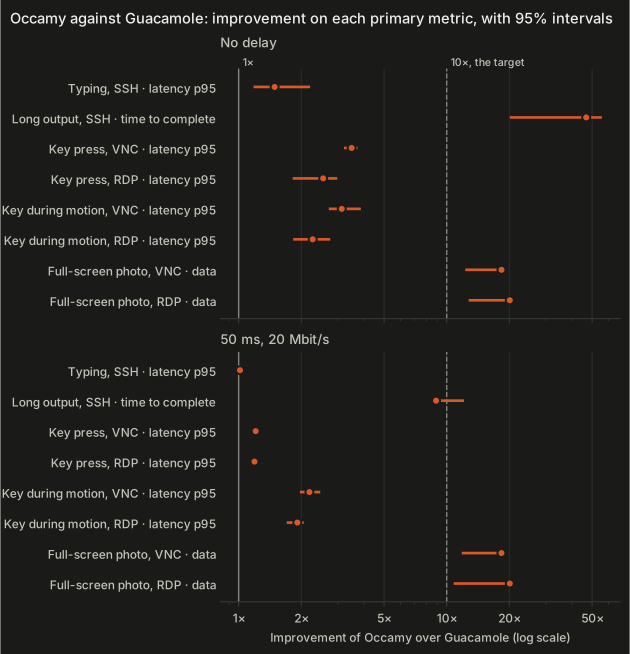
Each scenario's primary metric for Guacamole and Occamy, and the improvement of Occamy over Guacamole: above 1×, Occamy is better. Holm's correction is over these 16 tests. Target says whether the improvement meets the target of 10×, which it does where its interval's lower bound is at least 10×.
| Scenario | Network | Metric | Guacamole | Occamy | Improvement | p | p (Holm) | Target |
|---|---|---|---|---|---|---|---|---|
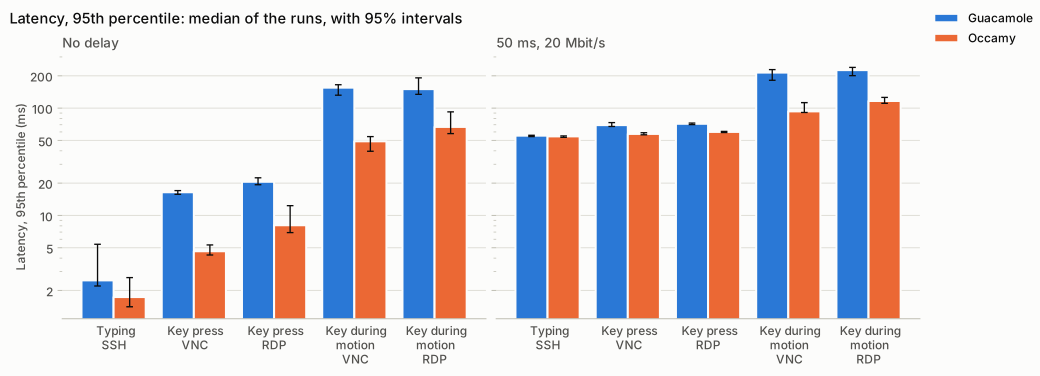
| Typing, SSH | No delay | Latency, 95th percentile (ms) | 2.48 [2.20, 5.39] | 1.73 [1.41, 2.63] | 1.49× [1.18, 2.21] | 0.0260 | 0.0519 | no |
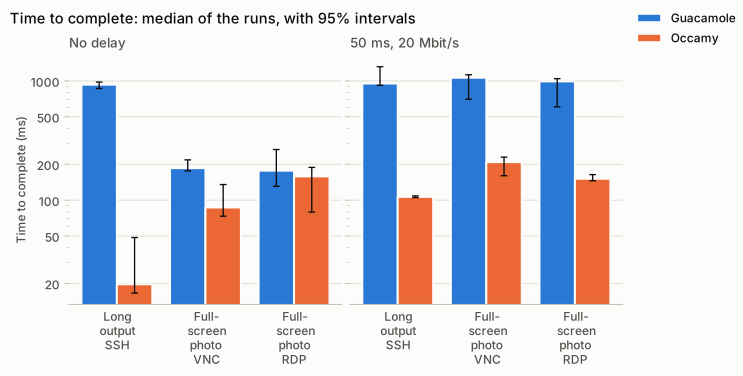
| Long output, SSH | No delay | Time to complete (ms) | 930 [864, 978] | 19.7 [16.6, 48.6] | 46.8× [20.1, 55.7] | 0.0022 | 0.0346 | met |
| Key press, VNC | No delay | Latency, 95th percentile (ms) | 16.4 [15.7, 17.0] | 4.64 [4.28, 5.31] | 3.49× [3.21, 3.73] | 0.0022 | 0.0346 | no |
| Key press, RDP | No delay | Latency, 95th percentile (ms) | 20.6 [19.3, 22.4] | 8.10 [6.92, 12.3] | 2.55× [1.82, 2.98] | 0.0022 | 0.0346 | no |
| Key during motion, VNC | No delay | Latency, 95th percentile (ms) | 155 [132, 165] | 49.0 [39.6, 54.3] | 3.13× [2.71, 3.87] | 0.0022 | 0.0346 | no |
| Key during motion, RDP | No delay | Latency, 95th percentile (ms) | 150 [135, 191] | 66.8 [57.9, 92.3] | 2.27× [1.83, 2.76] | 0.0022 | 0.0346 | no |
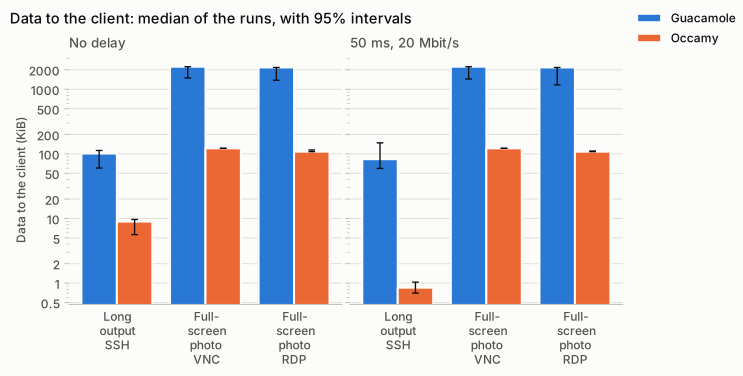
| Full-screen photo, VNC | No delay | Data to the client (KiB) | 2,235 [1,497, 2,235] | 122 [122, 122] | 18.3× [12.3, 18.3] | 0.0022 | 0.0346 | met |
| Full-screen photo, RDP | No delay | Data to the client (KiB) | 2,175 [1,379, 2,175] | 108 [108, 115] | 20.1× [12.7, 20.1] | 0.0022 | 0.0346 | met |
| Typing, SSH | 50 ms, 20 Mbit/s | Latency, 95th percentile (ms) | 55.4 [54.3, 55.8] | 54.5 [53.4, 55.1] | 1.02× [0.999, 1.03] | 0.0649 | 0.0649 | no |
| Long output, SSH | 50 ms, 20 Mbit/s | Time to complete (ms) | 951 [917, 1,316] | 107 [105, 109] | 8.89× [8.54, 12.1] | 0.0022 | 0.0346 | no |
| Key press, VNC | 50 ms, 20 Mbit/s | Latency, 95th percentile (ms) | 69.4 [67.5, 73.3] | 57.5 [56.4, 59.0] | 1.21× [1.18, 1.24] | 0.0022 | 0.0346 | no |
| Key press, RDP | 50 ms, 20 Mbit/s | Latency, 95th percentile (ms) | 71.4 [70.2, 72.6] | 60.0 [59.3, 60.7] | 1.19× [1.18, 1.21] | 0.0022 | 0.0346 | no |
| Key during motion, VNC | 50 ms, 20 Mbit/s | Latency, 95th percentile (ms) | 214 [182, 229] | 93.2 [91.1, 113] | 2.19× [1.97, 2.47] | 0.0022 | 0.0346 | no |
| Key during motion, RDP | 50 ms, 20 Mbit/s | Latency, 95th percentile (ms) | 226 [201, 240] | 117 [111, 126] | 1.91× [1.70, 2.05] | 0.0022 | 0.0346 | no |
| Full-screen photo, VNC | 50 ms, 20 Mbit/s | Data to the client (KiB) | 2,235 [1,441, 2,235] | 122 [122, 122] | 18.3× [11.8, 18.3] | 0.0022 | 0.0346 | met |
| Full-screen photo, RDP | 50 ms, 20 Mbit/s | Data to the client (KiB) | 2,175 [1,169, 2,175] | 108 [108, 111] | 20.1× [10.8, 20.1] | 0.0022 | 0.0346 | met |
14 of the 16 differences are significant after the correction, and 5 of the 16 improvements meet the target of 10×.
Secondary metrics
The other metrics that each scenario records, for Guacamole and Occamy. They're exploratory, and their p-values aren't corrected.
| Scenario | Network | Metric | Guacamole | Occamy | Improvement | p |
|---|---|---|---|---|---|---|
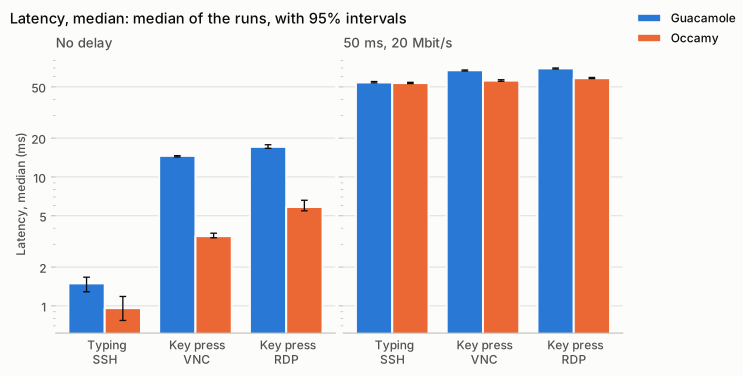
| Typing, SSH | No delay | Latency, median (ms) | 1.49 [1.28, 1.67] | 0.96 [0.77, 1.18] | 1.54× [1.22, 1.98] | 0.0022 |
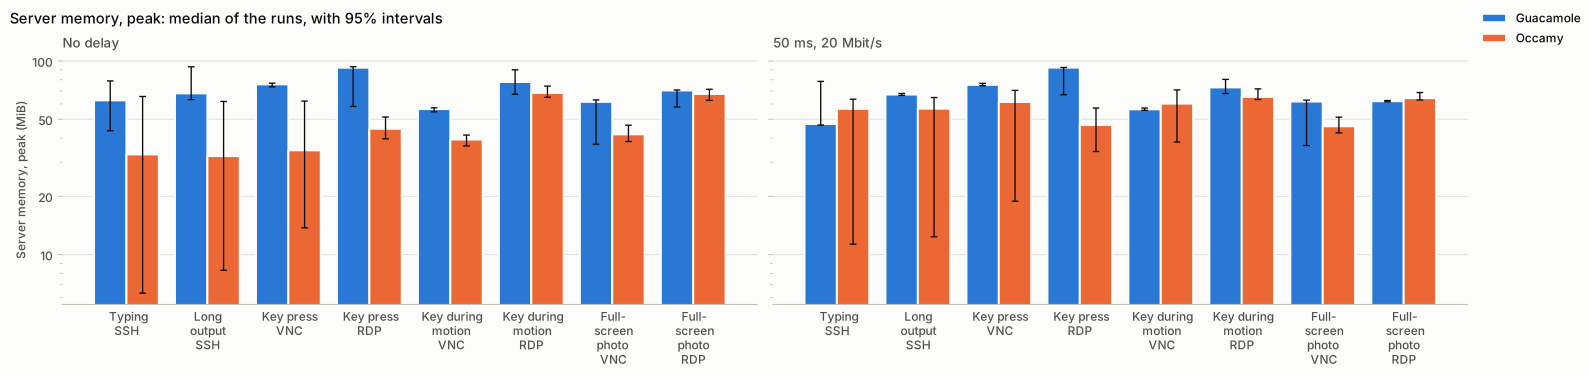
| Typing, SSH | No delay | Server memory, peak (MiB) | 62.7 [43.6, 78.9] | 32.9 [6.32, 65.6] | 2.31× [0.787, 6.99] | 0.1797 |
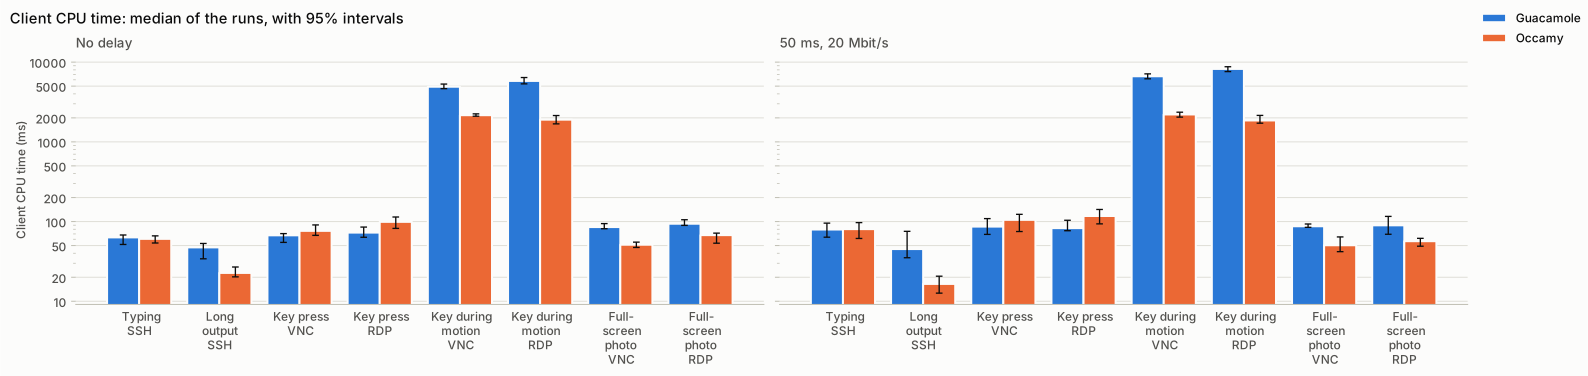
| Typing, SSH | No delay | Client CPU time (ms) | 63.3 [51.6, 67.9] | 60.7 [53.9, 66.2] | 1.02× [0.852, 1.17] | 0.6991 |
| Long output, SSH | No delay | Data to the client (KiB) | 101 [60.4, 113] | 8.95 [5.64, 9.67] | 11.4× [7.60, 14.3] | 0.0022 |
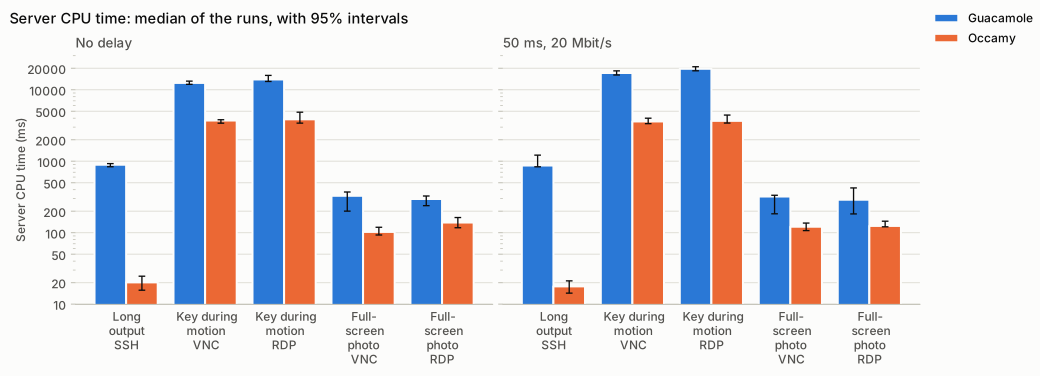
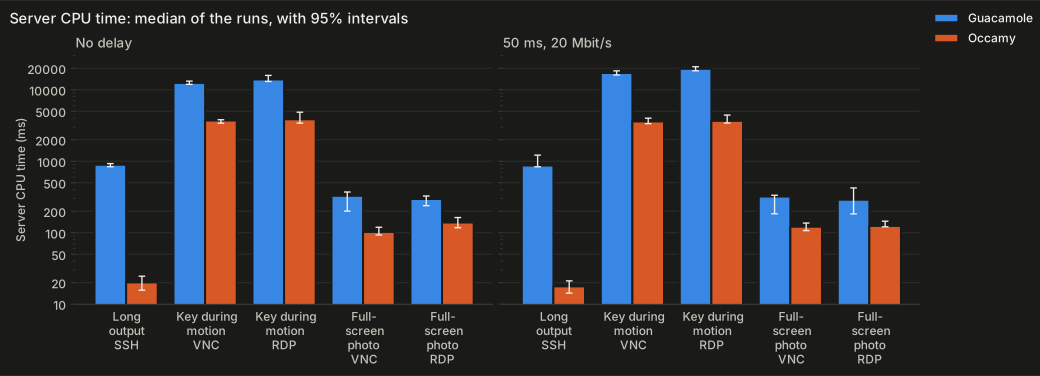
| Long output, SSH | No delay | Server CPU time (ms) | 892 [838, 926] | 20.2 [15.7, 24.6] | 43.8× [37.6, 55.2] | 0.0022 |
| Long output, SSH | No delay | Server memory, peak (MiB) | 68.0 [63.2, 93.4] | 32.3 [8.30, 61.8] | 3.02× [1.21, 7.61] | 0.0022 |
| Long output, SSH | No delay | Client CPU time (ms) | 47.5 [34.1, 53.1] | 22.7 [20.3, 26.9] | 1.97× [1.45, 2.32] | 0.0022 |
| Key press, VNC | No delay | Latency, median (ms) | 14.6 [14.3, 14.6] | 3.47 [3.37, 3.66] | 4.18× [4.00, 4.24] | 0.0022 |
| Key press, VNC | No delay | Server memory, peak (MiB) | 75.8 [73.5, 76.8] | 34.6 [13.7, 62.1] | 2.49× [1.24, 5.35] | 0.0022 |
| Key press, VNC | No delay | Client CPU time (ms) | 67.2 [54.8, 70.6] | 76.4 [67.1, 90.7] | 0.833× [0.695, 1.01] | 0.0931 |
| Key press, RDP | No delay | Latency, median (ms) | 17.1 [16.7, 17.8] | 5.85 [5.46, 6.59] | 2.90× [2.70, 3.13] | 0.0022 |
| Key press, RDP | No delay | Server memory, peak (MiB) | 92.4 [58.3, 93.5] | 44.7 [39.7, 51.4] | 2.06× [1.47, 2.32] | 0.0022 |
| Key press, RDP | No delay | Client CPU time (ms) | 72.8 [63.6, 85.3] | 99.2 [82.1, 114] | 0.728× [0.62, 0.854] | 0.0043 |
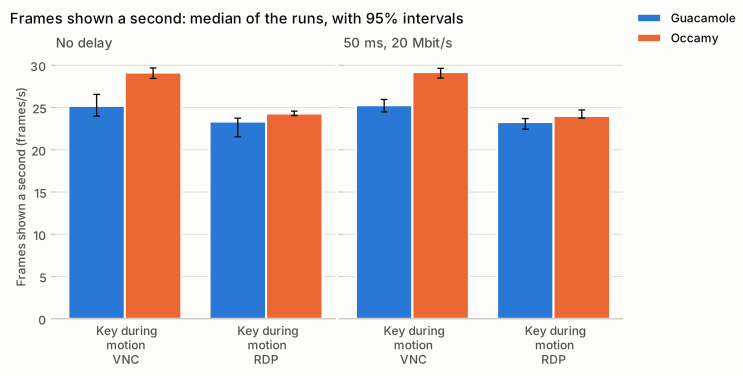
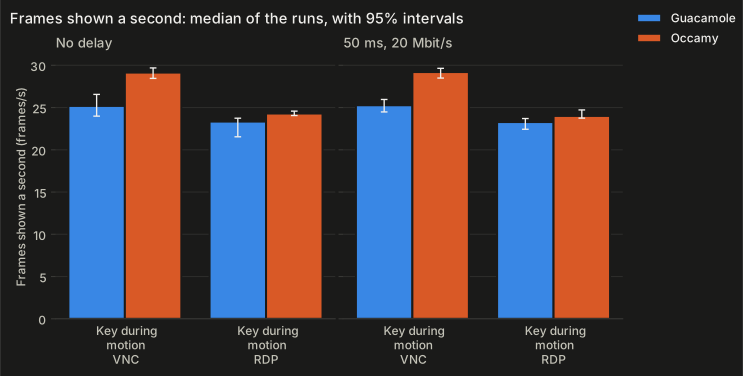
| Key during motion, VNC | No delay | Frames shown a second (frames/s) | 25.2 [24.0, 26.6] | 29.1 [28.4, 29.7] | 1.15× [1.11, 1.22] | 0.0022 |
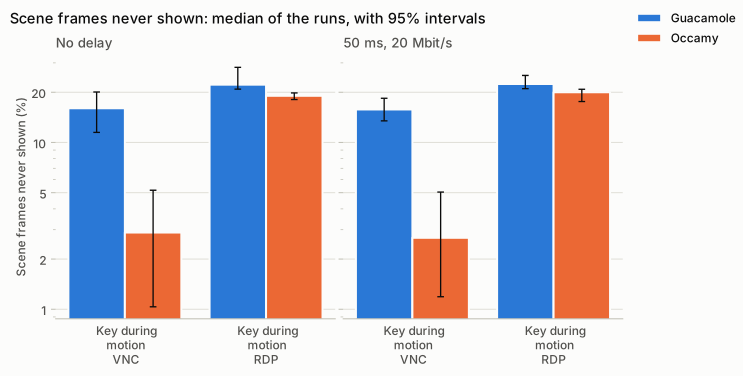
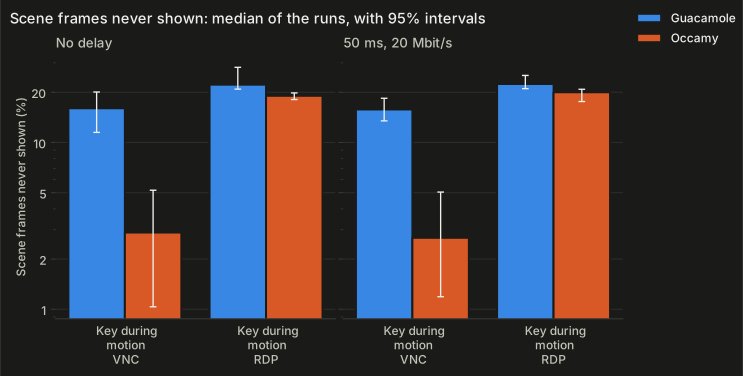
| Key during motion, VNC | No delay | Scene frames never shown (%) | 16.0 [11.5, 20.1] | 2.89 [1.03, 5.17] | 5.61× [2.95, 16.8] | 0.0022 |
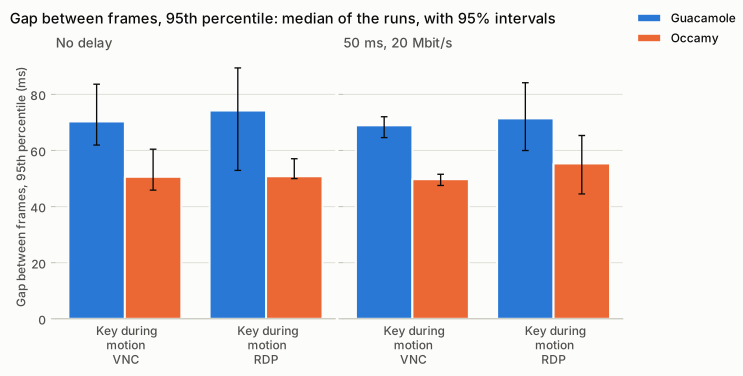
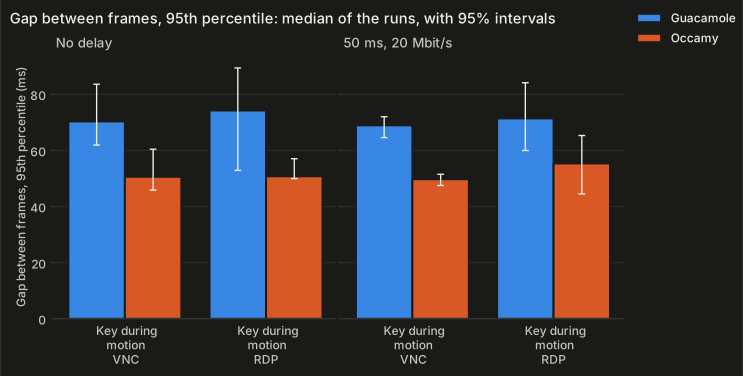
| Key during motion, VNC | No delay | Gap between frames, 95th percentile (ms) | 70.3 [61.9, 83.6] | 50.6 [45.9, 60.5] | 1.40× [1.22, 1.64] | 0.0022 |
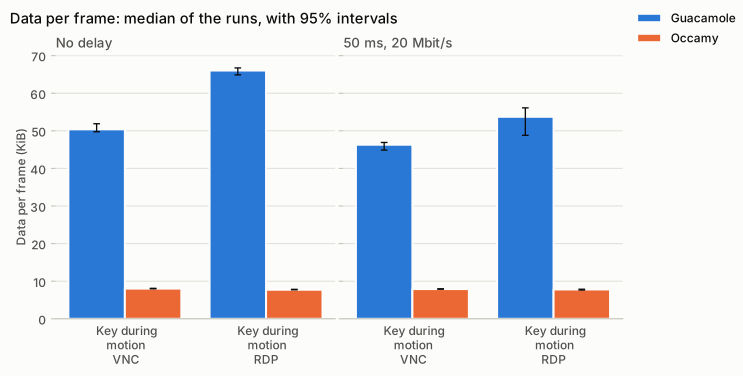
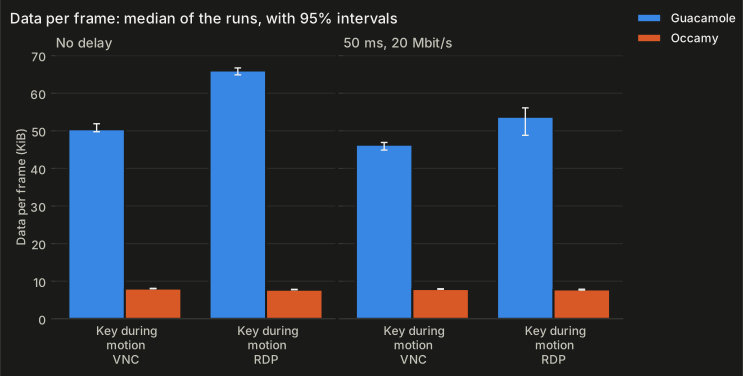
| Key during motion, VNC | No delay | Data per frame (KiB) | 50.4 [49.8, 51.9] | 8.02 [7.97, 8.10] | 6.27× [6.21, 6.45] | 0.0022 |
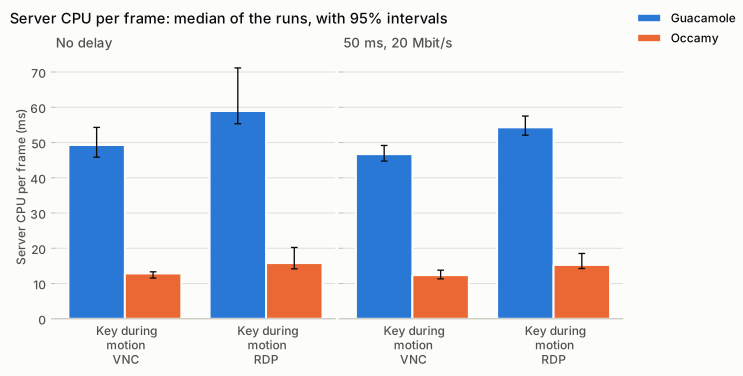
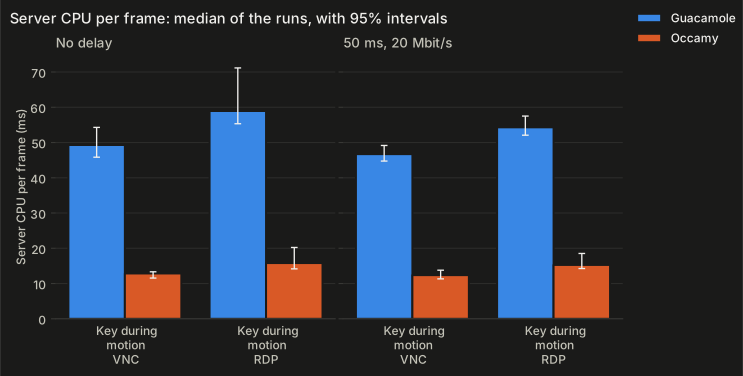
| Key during motion, VNC | No delay | Server CPU per frame (ms) | 49.3 [45.8, 54.3] | 12.9 [11.5, 13.3] | 3.89× [3.50, 4.32] | 0.0022 |
| Key during motion, VNC | No delay | Server CPU time (ms) | 12,471 [11,923, 13,194] | 3,706 [3,407, 3,810] | 3.39× [3.24, 3.60] | 0.0022 |
| Key during motion, VNC | No delay | Server memory, peak (MiB) | 56.5 [54.7, 57.3] | 39.3 [36.4, 41.5] | 1.44× [1.36, 1.50] | 0.0022 |
| Key during motion, VNC | No delay | Client CPU time (ms) | 4,908 [4,644, 5,302] | 2,159 [2,095, 2,242] | 2.26× [2.16, 2.38] | 0.0022 |
| Key during motion, RDP | No delay | Frames shown a second (frames/s) | 23.3 [21.5, 23.7] | 24.3 [24.1, 24.6] | 1.04× [1.03, 1.12] | 0.0022 |
| Key during motion, RDP | No delay | Scene frames never shown (%) | 22.2 [20.9, 28.2] | 19.0 [18.1, 19.8] | 1.17× [1.10, 1.42] | 0.0022 |
| Key during motion, RDP | No delay | Gap between frames, 95th percentile (ms) | 74.2 [52.9, 89.4] | 50.8 [50.0, 57.1] | 1.38× [1.06, 1.68] | 0.0043 |
| Key during motion, RDP | No delay | Data per frame (KiB) | 66.0 [64.9, 66.7] | 7.73 [7.71, 7.84] | 8.53× [8.41, 8.63] | 0.0022 |
| Key during motion, RDP | No delay | Server CPU per frame (ms) | 58.9 [55.3, 71.2] | 15.8 [14.2, 20.2] | 3.83× [3.31, 4.48] | 0.0022 |
| Key during motion, RDP | No delay | Server CPU time (ms) | 13,938 [13,059, 15,869] | 3,855 [3,414, 4,855] | 3.70× [3.20, 4.13] | 0.0022 |
| Key during motion, RDP | No delay | Server memory, peak (MiB) | 77.9 [67.3, 90.1] | 68.4 [64.9, 74.2] | 1.15× [1.04, 1.31] | 0.0411 |
| Key during motion, RDP | No delay | Client CPU time (ms) | 5,808 [5,334, 6,410] | 1,897 [1,680, 2,138] | 3.13× [2.74, 3.49] | 0.0022 |
| Full-screen photo, VNC | No delay | Time to complete (ms) | 186 [176, 218] | 86.8 [73.4, 135] | 2.23× [1.61, 2.51] | 0.0022 |
| Full-screen photo, VNC | No delay | Server CPU time (ms) | 328 [200, 371] | 102 [92.9, 119] | 3.23× [2.15, 3.55] | 0.0022 |
| Full-screen photo, VNC | No delay | Server memory, peak (MiB) | 61.5 [37.2, 63.0] | 41.8 [38.4, 46.6] | 1.46× [0.968, 1.57] | 0.0649 |
| Full-screen photo, VNC | No delay | Client CPU time (ms) | 85.3 [81.2, 94.2] | 51.2 [47.3, 55.2] | 1.68× [1.57, 1.82] | 0.0022 |
| Full-screen photo, RDP | No delay | Time to complete (ms) | 177 [131, 266] | 158 [79.4, 188] | 1.39× [0.815, 2.23] | 0.3939 |
| Full-screen photo, RDP | No delay | Server CPU time (ms) | 296 [239, 326] | 139 [117, 163] | 2.06× [1.76, 2.40] | 0.0022 |
| Full-screen photo, RDP | No delay | Server memory, peak (MiB) | 70.4 [57.8, 70.9] | 67.5 [62.6, 71.4] | 1.03× [0.924, 1.09] | 0.3095 |
| Full-screen photo, RDP | No delay | Client CPU time (ms) | 93.8 [89.4, 105] | 67.5 [53.5, 71.6] | 1.47× [1.29, 1.69] | 0.0022 |
| Typing, SSH | 50 ms, 20 Mbit/s | Latency, median (ms) | 54.1 [53.6, 55.0] | 53.5 [53.0, 54.2] | 1.01× [0.994, 1.03] | 0.0931 |
| Typing, SSH | 50 ms, 20 Mbit/s | Server memory, peak (MiB) | 47.3 [46.7, 78.5] | 56.6 [11.3, 63.5] | 0.845× [0.749, 4.13] | 0.3095 |
| Typing, SSH | 50 ms, 20 Mbit/s | Client CPU time (ms) | 79.5 [63.6, 95.5] | 80.4 [61.4, 97.1] | 1.00× [0.76, 1.36] | 1.0000 |
| Long output, SSH | 50 ms, 20 Mbit/s | Data to the client (KiB) | 82.7 [59.6, 148] | 0.849 [0.699, 1.04] | 96.1× [66.3, 182] | 0.0022 |
| Long output, SSH | 50 ms, 20 Mbit/s | Server CPU time (ms) | 870 [836, 1,216] | 17.7 [14.3, 21.2] | 52.5× [43.5, 66.9] | 0.0022 |
| Long output, SSH | 50 ms, 20 Mbit/s | Server memory, peak (MiB) | 67.1 [66.4, 68.0] | 56.7 [12.4, 64.8] | 1.18× [1.04, 5.37] | 0.0022 |
| Long output, SSH | 50 ms, 20 Mbit/s | Client CPU time (ms) | 45.2 [35.2, 75.4] | 16.5 [12.7, 20.7] | 2.83× [1.94, 4.27] | 0.0022 |
| Key press, VNC | 50 ms, 20 Mbit/s | Latency, median (ms) | 67.3 [66.3, 67.6] | 55.9 [55.2, 56.7] | 1.20× [1.18, 1.22] | 0.0022 |
| Key press, VNC | 50 ms, 20 Mbit/s | Server memory, peak (MiB) | 75.3 [74.5, 76.7] | 61.4 [18.9, 70.5] | 1.23× [1.09, 3.95] | 0.0022 |
| Key press, VNC | 50 ms, 20 Mbit/s | Client CPU time (ms) | 86.4 [69.0, 109] | 105 [74.9, 123] | 0.839× [0.666, 1.11] | 0.2403 |
| Key press, RDP | 50 ms, 20 Mbit/s | Latency, median (ms) | 69.5 [68.7, 70.0] | 58.3 [57.9, 59.1] | 1.19× [1.18, 1.20] | 0.0022 |
| Key press, RDP | 50 ms, 20 Mbit/s | Server memory, peak (MiB) | 92.5 [67.0, 92.6] | 46.7 [34.1, 57.2] | 1.88× [1.61, 2.15] | 0.0022 |
| Key press, RDP | 50 ms, 20 Mbit/s | Client CPU time (ms) | 82.7 [76.8, 104] | 117 [93.6, 142] | 0.761× [0.593, 0.918] | 0.0260 |
| Key during motion, VNC | 50 ms, 20 Mbit/s | Frames shown a second (frames/s) | 25.3 [24.5, 26.0] | 29.2 [28.5, 29.6] | 1.15× [1.12, 1.19] | 0.0022 |
| Key during motion, VNC | 50 ms, 20 Mbit/s | Scene frames never shown (%) | 15.8 [13.5, 18.4] | 2.68 [1.19, 5.04] | 5.95× [3.65, 11.3] | 0.0022 |
| Key during motion, VNC | 50 ms, 20 Mbit/s | Gap between frames, 95th percentile (ms) | 69.0 [64.6, 72.0] | 49.8 [47.5, 51.5] | 1.37× [1.30, 1.45] | 0.0022 |
| Key during motion, VNC | 50 ms, 20 Mbit/s | Data per frame (KiB) | 46.3 [44.9, 46.9] | 7.90 [7.87, 7.97] | 5.86× [5.70, 5.93] | 0.0022 |
| Key during motion, VNC | 50 ms, 20 Mbit/s | Server CPU per frame (ms) | 46.7 [44.7, 49.2] | 12.4 [11.3, 13.8] | 3.77× [3.32, 4.10] | 0.0022 |
| Key during motion, VNC | 50 ms, 20 Mbit/s | Server CPU time (ms) | 17,164 [16,097, 18,395] | 3,603 [3,353, 3,999] | 4.76× [4.23, 5.24] | 0.0022 |
| Key during motion, VNC | 50 ms, 20 Mbit/s | Server memory, peak (MiB) | 56.3 [55.6, 57.1] | 60.2 [38.2, 70.9] | 0.936× [0.806, 1.47] | 0.3939 |
| Key during motion, VNC | 50 ms, 20 Mbit/s | Client CPU time (ms) | 6,644 [6,179, 7,121] | 2,206 [2,041, 2,355] | 3.01× [2.75, 3.26] | 0.0022 |
| Key during motion, RDP | 50 ms, 20 Mbit/s | Frames shown a second (frames/s) | 23.3 [22.4, 23.7] | 24.0 [23.7, 24.7] | 1.04× [1.01, 1.06] | 0.0022 |
| Key during motion, RDP | 50 ms, 20 Mbit/s | Scene frames never shown (%) | 22.4 [21.0, 25.2] | 20.0 [17.6, 20.8] | 1.14× [1.04, 1.27] | 0.0022 |
| Key during motion, RDP | 50 ms, 20 Mbit/s | Gap between frames, 95th percentile (ms) | 71.4 [60.0, 84.2] | 55.4 [44.5, 65.3] | 1.30× [1.09, 1.53] | 0.0043 |
| Key during motion, RDP | 50 ms, 20 Mbit/s | Data per frame (KiB) | 53.7 [48.8, 56.1] | 7.79 [7.64, 7.87] | 6.93× [6.39, 7.17] | 0.0022 |
| Key during motion, RDP | 50 ms, 20 Mbit/s | Server CPU per frame (ms) | 54.3 [52.1, 57.5] | 15.3 [14.3, 18.5] | 3.62× [3.10, 3.86] | 0.0022 |
| Key during motion, RDP | 50 ms, 20 Mbit/s | Server CPU time (ms) | 19,641 [18,438, 20,991] | 3,668 [3,422, 4,428] | 5.28× [4.74, 5.78] | 0.0022 |
| Key during motion, RDP | 50 ms, 20 Mbit/s | Server memory, peak (MiB) | 73.1 [67.9, 80.4] | 65.3 [63.2, 71.8] | 1.09× [1.03, 1.23] | 0.0152 |
| Key during motion, RDP | 50 ms, 20 Mbit/s | Client CPU time (ms) | 8,207 [7,608, 8,758] | 1,854 [1,713, 2,147] | 4.33× [3.98, 4.73] | 0.0022 |
| Full-screen photo, VNC | 50 ms, 20 Mbit/s | Time to complete (ms) | 1,064 [702, 1,127] | 208 [160, 230] | 5.09× [4.38, 5.76] | 0.0022 |
| Full-screen photo, VNC | 50 ms, 20 Mbit/s | Server CPU time (ms) | 320 [184, 334] | 121 [107, 136] | 2.54× [1.72, 2.91] | 0.0022 |
| Full-screen photo, VNC | 50 ms, 20 Mbit/s | Server memory, peak (MiB) | 61.8 [36.6, 62.8] | 46.0 [42.6, 51.3] | 1.32× [0.86, 1.44] | 0.0649 |
| Full-screen photo, VNC | 50 ms, 20 Mbit/s | Client CPU time (ms) | 87.3 [84.7, 93.3] | 50.4 [41.9, 64.2] | 1.74× [1.45, 2.02] | 0.0022 |
| Full-screen photo, RDP | 50 ms, 20 Mbit/s | Time to complete (ms) | 991 [606, 1,044] | 151 [145, 164] | 6.37× [4.17, 6.95] | 0.0022 |
| Full-screen photo, RDP | 50 ms, 20 Mbit/s | Server CPU time (ms) | 289 [183, 423] | 124 [121, 145] | 2.31× [1.49, 2.92] | 0.0022 |
| Full-screen photo, RDP | 50 ms, 20 Mbit/s | Server memory, peak (MiB) | 62.0 [61.6, 62.5] | 64.3 [62.9, 68.7] | 0.964× [0.91, 0.983] | 0.0022 |
| Full-screen photo, RDP | 50 ms, 20 Mbit/s | Client CPU time (ms) | 89.6 [69.3, 116] | 56.7 [49.1, 61.6] | 1.63× [1.41, 1.90] | 0.0022 |
The 50 ms target
A key's effect should show within 50 ms on the network with no delay and on the one with a 20 ms round trip. The target is met where the upper bound of the 95% interval of the latency's 95th percentile is at most 50 ms. With no delay, the latency is the server's own processing; the other network adds its round trip.
| Series | Scenario | Network | Latency, 95th percentile (ms) | Met |
|---|---|---|---|---|
| Occamy | Typing, SSH | No delay | 1.73 [1.41, 2.63] | met |
| Occamy | Key press, VNC | No delay | 4.64 [4.28, 5.31] | met |
| Occamy | Key press, RDP | No delay | 8.10 [6.92, 12.3] | met |
| Occamy | Key during motion, VNC | No delay | 49.0 [39.6, 54.3] | no |
| Occamy | Key during motion, RDP | No delay | 66.8 [57.9, 92.3] | no |
occamyd's runtime
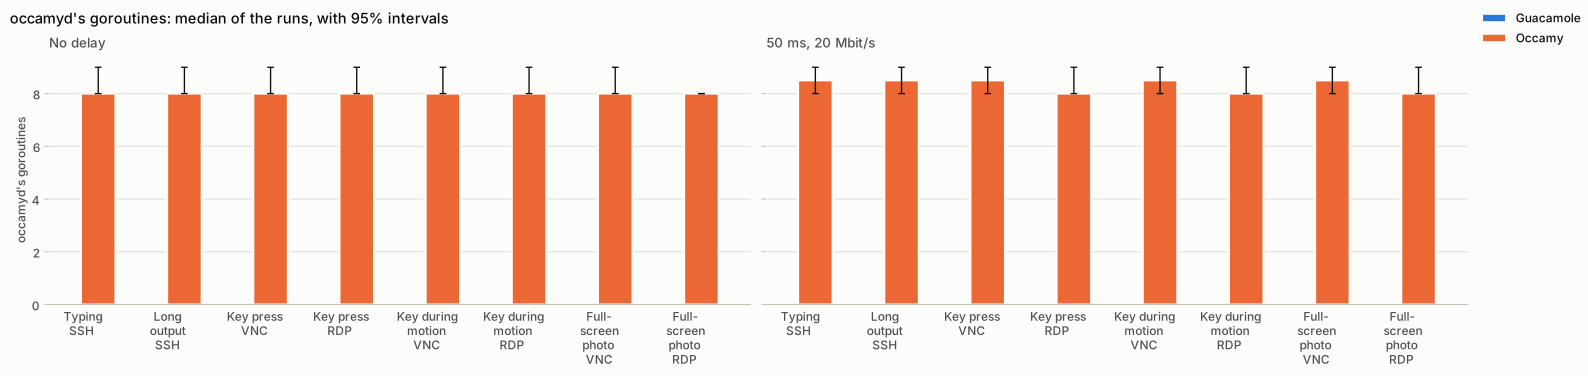
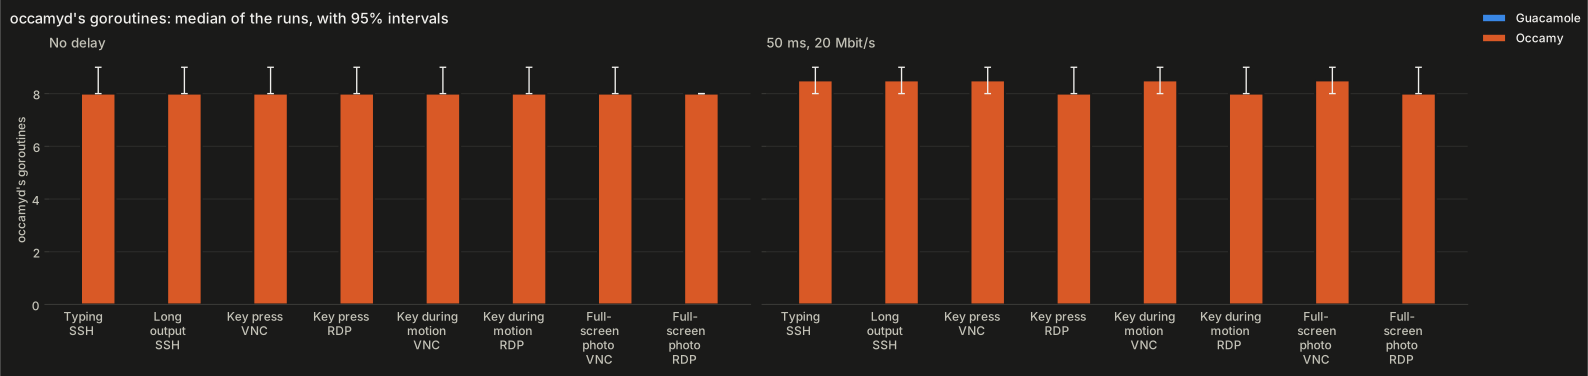
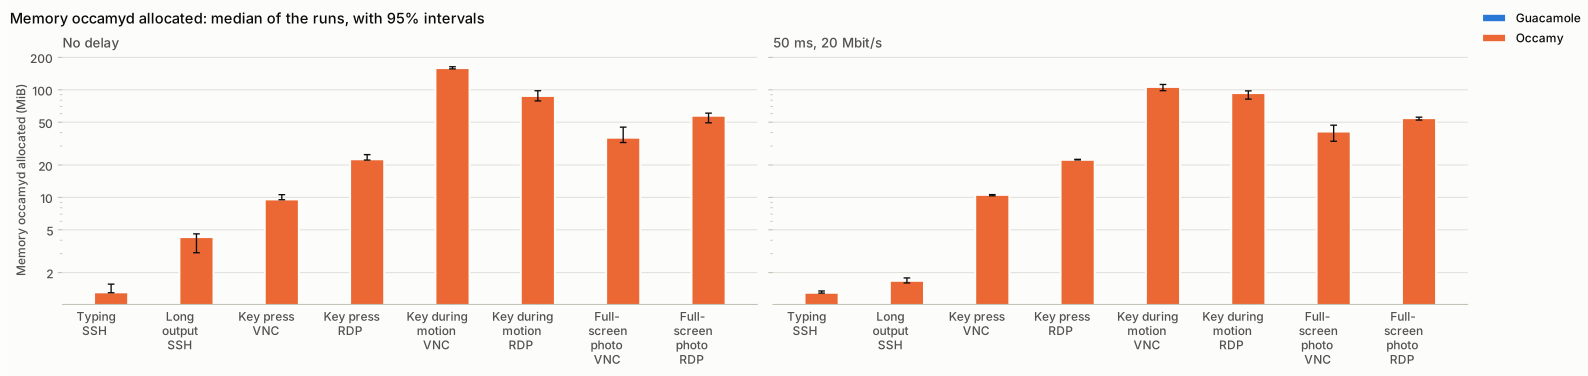
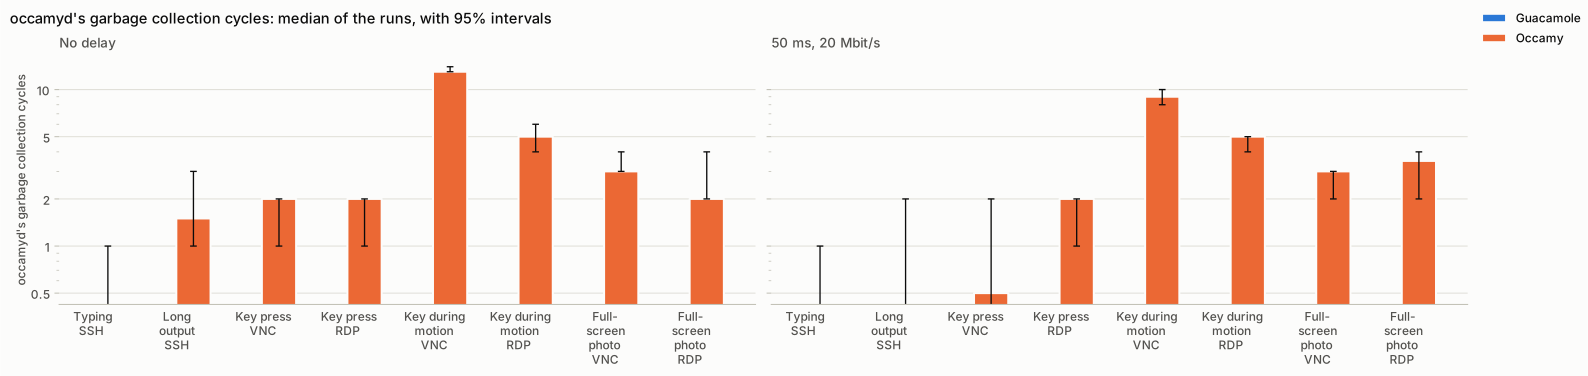
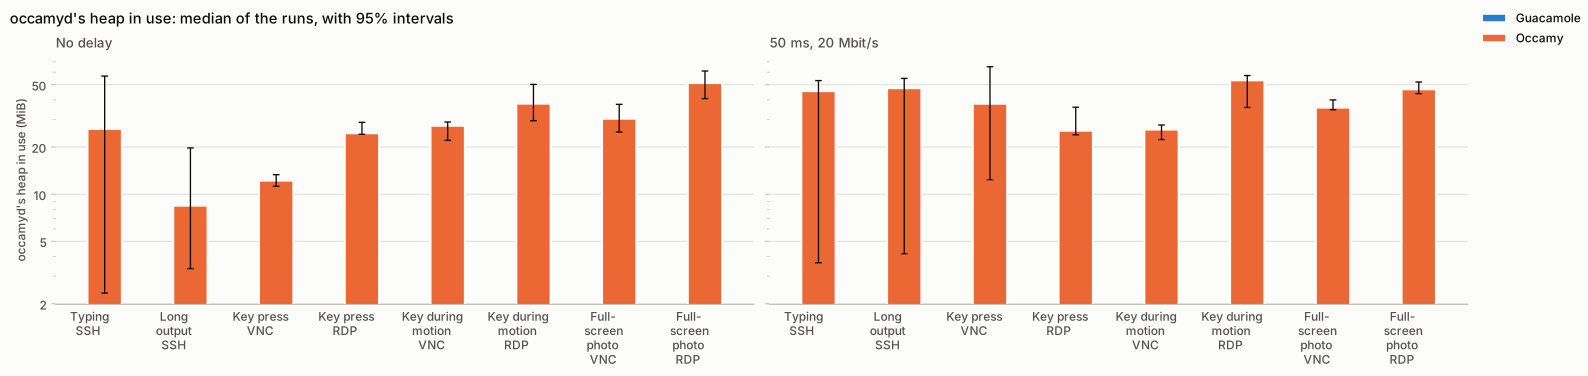
For each scenario and network, the median of the runs: the memory occamyd allocated and the garbage collection cycles it ran during the scenario, and its heap in use and its goroutines at the end.
| Series | Scenario | Network | Allocated (MiB) | GC cycles | Heap (MiB) | Goroutines |
|---|---|---|---|---|---|---|
| Occamy | Typing, SSH | No delay | 1.31 | 0 | 26.1 | 8.00 |
| Occamy | Long output, SSH | No delay | 4.28 | 1.50 | 8.45 | 8.00 |
| Occamy | Key press, VNC | No delay | 9.59 | 2.00 | 12.2 | 8.00 |
| Occamy | Key press, RDP | No delay | 22.6 | 2.00 | 24.5 | 8.00 |
| Occamy | Key during motion, VNC | No delay | 159 | 13.0 | 27.3 | 8.00 |
| Occamy | Key during motion, RDP | No delay | 87.7 | 5.00 | 37.8 | 8.00 |
| Occamy | Full-screen photo, VNC | No delay | 35.9 | 3.00 | 30.3 | 8.00 |
| Occamy | Full-screen photo, RDP | No delay | 57.4 | 2.00 | 51.2 | 8.00 |
| Occamy | Typing, SSH | 50 ms, 20 Mbit/s | 1.30 | 0 | 45.5 | 8.50 |
| Occamy | Long output, SSH | 50 ms, 20 Mbit/s | 1.68 | 0 | 47.5 | 8.50 |
| Occamy | Key press, VNC | 50 ms, 20 Mbit/s | 10.6 | 0.5 | 37.8 | 8.50 |
| Occamy | Key press, RDP | 50 ms, 20 Mbit/s | 22.4 | 2.00 | 25.4 | 8.00 |
| Occamy | Key during motion, VNC | 50 ms, 20 Mbit/s | 106 | 9.00 | 25.8 | 8.50 |
| Occamy | Key during motion, RDP | 50 ms, 20 Mbit/s | 93.2 | 5.00 | 53.3 | 8.00 |
| Occamy | Full-screen photo, VNC | 50 ms, 20 Mbit/s | 40.9 | 3.00 | 35.7 | 8.50 |
| Occamy | Full-screen photo, RDP | 50 ms, 20 Mbit/s | 54.5 | 3.50 | 46.7 | 8.00 |
Sensitivity to the host's load
None of the 192 results started while the host's 1-minute load average was above the gate of 8, so no conclusion on a primary metric depends on the host's load.
Figures
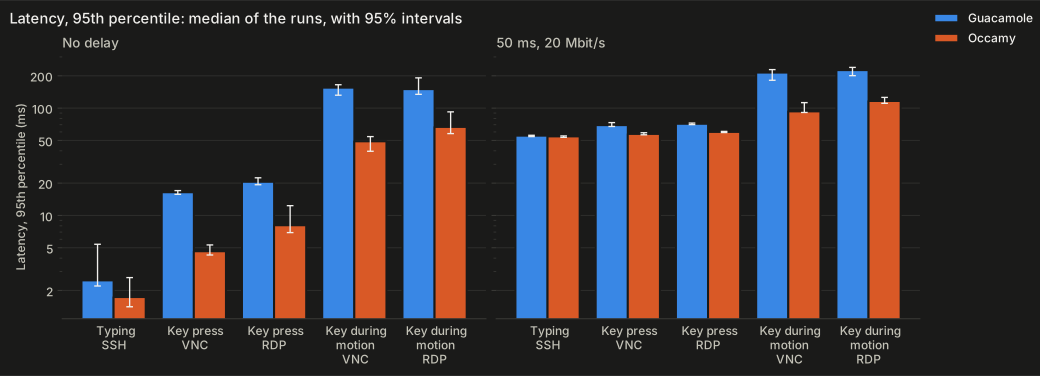
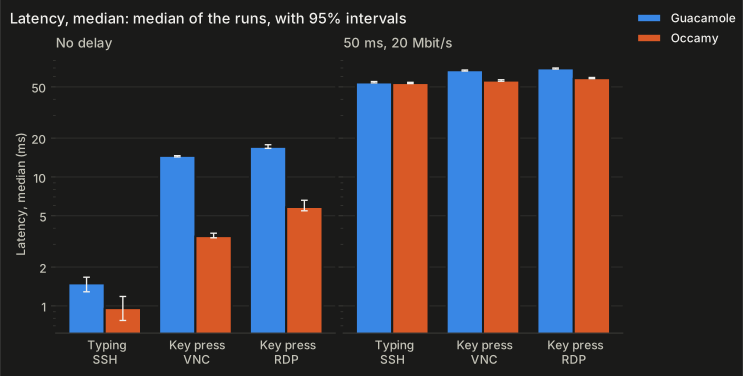
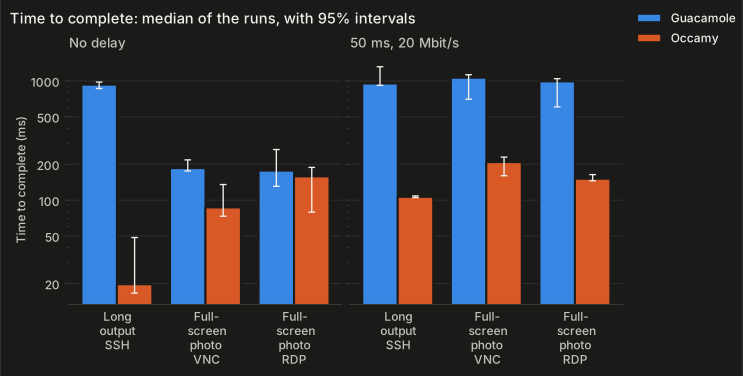
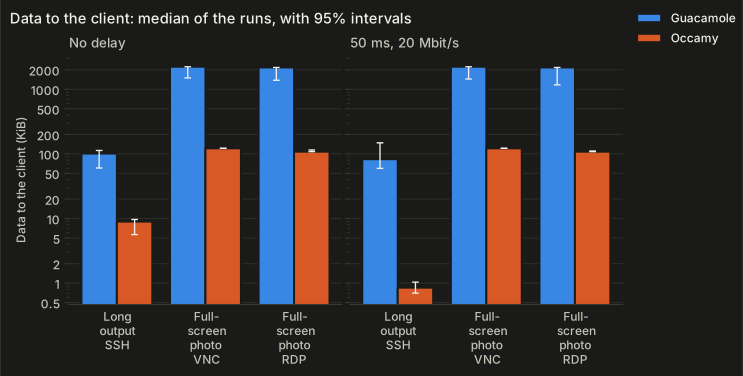
Each figure shows a metric's median for each series in each scenario, with its 95% interval, in a panel for each network. Where the values span more than a factor of ten, the axis is logarithmic.
Latency, 95th percentile
Latency, median
Time to complete
Data to the client
Frames shown a second
Scene frames never shown
Gap between frames, 95th percentile
Data per frame
Server CPU per frame
Server CPU time
Server memory, peak
Client CPU time
Memory occamyd allocated
occamyd's garbage collection cycles
occamyd's heap in use
occamyd's goroutines