Debugging and monitoring
Find out why a session failed, and keep an eye on a running occamyd.
This page starts from what you or your users see, and ends with a
reference to the log and the debug listener.
Where to look
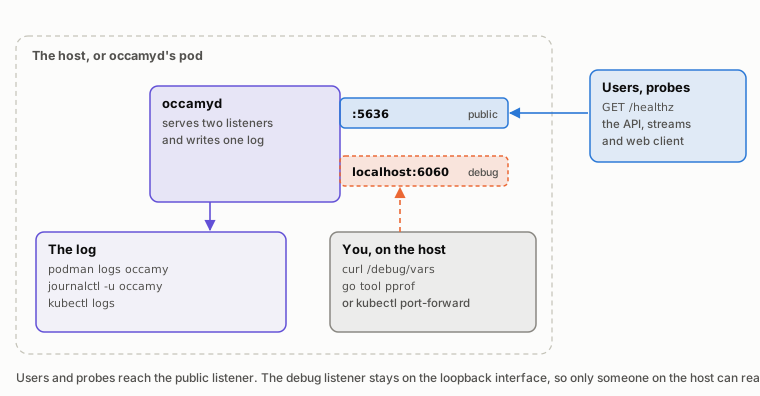
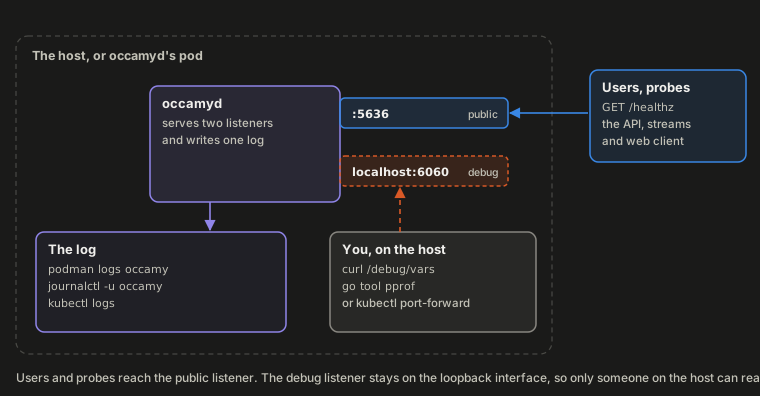
occamyd tells you about itself in three places: its log, the
health check at /healthz, and the debug listener, which serves
the Go runtime's numbers and profiles once you turn it on.
Start with the log. When a session can't connect, the web client says
why in a sentence, such as “The remote computer refused the
connection.”, but never names a host, an address or a fingerprint,
because everyone in the session reads it. The log has the whole error,
where your occamyd runs:
podman logs occamy             # the container of Deploy
journalctl -u occamy           # the systemd unit of Deploy
kubectl logs deploy/occamy     # a Deployment named occamy
Each session has an ID, which the line that opens it names, as in
session iveQDlpIpFSzK2wLN6Fr7Q: user "alice" opened …. Search the log
for that ID to find how the session went and how it ended.
occamyd doesn't start
occamyd checks the whole configuration before it serves anything. It
stops with every problem it found, each with its line and key:
config: 2 problems:
    line 7: conections: unknown key, did you mean connections?
    line 31: debug.address: "localhost:5636" shares a port with listen ":5636": give the debug listener a port of its own, since whatever reaches the one could reach the other
Configuration describes each key. These are the
other reasons that occamyd stops at start:
| It says | What to do |
|---|---|
cannot read the configuration file: …; name another with -conf |
Check the path. -conf names the file, ./conf.yaml by default |
auth: signing key …: occamyd runs as uid 65532, which may not use … |
Give the key's directory, or the volume mounted on it, to that user. The signing key has the step for a host, Docker and Podman |
listen tcp :5636: bind: address already in use |
Another process has the port. Stop it, or change listen |
tls: … |
tls.cert or tls.key doesn't load. Check that the two files are PEM and belong together |
occamyd can also start with warnings, each beginning with warning:.
Warnings at start lists them.
Users can't sign in
A wrong user name or password logs sign-in failed from the client's
address, without the user name, since people sometimes type a password
into it. Through OIDC, a failed sign-in logs OIDC sign-in failed from
the client's address with the reason, and the web client shows the
error code that
Signing in through OIDC
explains.
If everyone has to sign in again after a restart, or OIDC sign-ins
fail at once, look for created a new signing key or
OIDC discovery at … failed in the
warnings at start.
The session ends at once
A session opens in a few steps, and each one that fails leaves its own line in the log:
sequenceDiagram
  participant W as Web client
  participant P as Proxy
  participant O as occamyd
  participant R as Remote
  W->>P: GET …/connections/desktop/stream, a WebSocket upgrade
  P->>O: The same request, with Upgrade
  Note over O: Checks the origin, the token and the hello.<br/>A refusal logs: stream refused from …
  O-->>W: 101 Switching Protocols
  Note over O: Logs: session …: user … opened connection …
  O->>R: Connects, checks the certificate or host key, signs in
  Note over O: A failure logs: INFO session ended … reason=failed err=…
  O-->>W: welcome, then the first frame
Find the page's message in the first column, then the line in the log:
| The page says | The log says | What it means |
|---|---|---|
| Could not connect: “The remote computer refused the connection.” | session ended … reason=failed err="vnc: dial tcp 10.0.4.20:5900: connect: connection refused" |
Nothing listens at the connection's target. Check the address and the port, and that the remote's server runs |
| Could not connect: “The remote computer didn't answer in time.” | dial tcp 10.0.4.20:5900: i/o timeout |
A firewall between occamyd and the remote drops the connection, or the remote is off |
| Could not connect: “The server couldn't look up the remote computer's name.” | dial tcp: lookup build-box.lab: no such host |
The target's host name doesn't resolve where occamyd runs, which in a container is the container's DNS |
| Could not connect: “The server has no route to the remote computer.” | connect: no route to host |
occamyd's host has no route to the remote's network |
| Could not connect: “The server doesn't trust the remote computer's certificate.” | the server's certificate "…" (SHA-256 3F:A1:…) is not trusted |
The remote's certificate doesn't chain to a CA that occamyd trusts. Add the logged fingerprint to the connection's tls.pins, or give the issuing CA in tls.ca_file (Check a remote's certificate) |
| Could not connect: “The server doesn't trust the remote computer's host key.” | host key ssh-ed25519 SHA256:… is not pinned |
The SSH server's host key isn't in the connection's host_keys. Check that it's the key you expect, then add it |
| Could not connect: “The remote computer refused the user name or password.” | vnc: authentication failed or rdp: authentication failed |
Check the connection's credentials, and the file or variable that holds the password |
| Could not connect: “The remote computer refused the user name, password or key.” | ssh: … authentication failed: … unable to authenticate |
The SSH server refused the credentials. Check the connection's credentials, or its private key |
| Could not connect: “The Kubernetes API server refused the credentials.” | kubernetes: the API server refused the stream with 401 |
The connection's token is wrong or has expired |
| Could not connect: “The Kubernetes API server refused to open a shell in the pod.” | kubernetes: the API server refused the stream with 403 |
The token's role doesn't allow create on pods/exec in the pod's namespace |
| Could not connect: “The remote computer offers no sign-in method that the server accepts.” | set ard: true on connection "…" to allow it |
A Mac offers only Apple Remote Desktop's sign-in. Read the risk before you set ard: true |
| Could not connect: “The remote computer offers no sign-in method that the server accepts.” | allow TLS with security: tls on connection "…" |
The RDP server speaks no NLA, as xrdp doesn't. Set security: tls, and pin its certificate (xrdp) |
| Access refused | user "…" opening connection "…": too many sessions open |
The user already owns limits.sessions_per_user sessions |
| Access refused | user "…" opening connection "…": occamyd runs as many sessions as it takes |
occamyd runs limits.sessions sessions (Limits) |
| Access refused | stream refused from …: origin not allowed |
The page that opened the stream isn't on occamyd's origin, as when a proxy rewrites the Host header. List the page's origin in origins |
Session ended, with the session could not be opened under Details |
user "…" opening connection "…": and the cause |
occamyd failed on its own, such as when it can't read a password file |
Connection lost, saying that occamyd can't be reached |
"GET" "/api/v1/connections/…/stream" 426 |
The proxy doesn't pass the WebSocket upgrade on. If no such line appears at all, the proxy answered by itself (Serve it over TLS) |
Sessions drop after the same time
A stream that has nothing else to send carries a ping every 25
seconds, so a proxy that closes quiet connections after a minute, as
nginx does by default, keeps a still session. If users still see
Connection lost after about the same time in every session, a proxy
between them and occamyd limits how long a connection lasts, or
closes connections that are quiet for less than 25 seconds. The
streams' request lines, which appear as each stream ends, then all show
that duration:
2026/11/04 10:16:41 middleware.go:41: occamy: "GET" "/api/v1/connections/desktop/stream" 101 10m0.004s 127.0.0.1:41818
Raise the proxy's limit above 30 minutes, the time after which a
session without input ends anyway
(What each hop needs). Join again
returns the owner to the session within a minute; after that, the
session ends with reason="owner left".
Disconnected: too slow
occamyd disconnects a viewer that acknowledges no frame, or takes
none of what it's sent, for streams.viewer_timeout, and logs:
INFO viewer dropped viewer=2 err="stream: the viewer stopped taking frames: no frame acknowledged for 30s"
The viewer's network stalled, or its device couldn't keep up. The
session goes on, and Join again returns to it. On networks that
stall for longer, raise streams.viewer_timeout
(Streams).
Typing feels slow
occamyd logs nothing for a slow session, so look at what a key goes
through: the round trip from the user to occamyd and on to the
remote, plus the time the remote takes to draw and occamyd takes to
encode.
| Check | What it tells you |
|---|---|
| An SSH session beside a desktop | A terminal has little to draw. If it's slow too, the network is; if only the desktop is, look at the remote and at occamyd's CPU |
Where occamyd and the proxy run |
Put occamyd near the remotes, and the proxy near occamyd. A proxy in another region adds its round trip to every key |
TCP congestion control: bbr at the start of the log, or tcp_congestion in /debug/vars |
Whether the connections use BBR, which keeps a desktop's frame rate on a link that loses packets (TCP congestion control) |
occamyd's CPU, in podman stats or top |
If it's busy, a CPU profile shows where. Many RDP desktops in motion can wait for their share of limits.decode_cores (Limits) |
The system that occamyd runs on |
On Linux and macOS, occamyd limits the bytes that the kernel keeps queued on each stream, so that a key's frame doesn't wait behind data the viewer will never need; Windows has no such limit. If the kernel refuses it, the log says stream from …: setting TCP_NOTSENT_LOWAT: with the error |
Benchmarks shows how long keys take to show through Occamy and through Guacamole on the same paths.
The screen is black, or parts are missing
A Windows desktop over RDP that stays nearly black needs
disable_gfx: true on its connection
(Connect Windows hosts). occamyd
warns of it at the first part of the screen that it can't draw:
WARN rdp: the server draws with GFX that the client does not decode yet, so parts of the screen may stay missing or stale; to turn GFX off, set disable_gfx: true on the target's connection, and reach an ad-hoc target, which cannot set it, through a connection session=… addr=10.0.4.20:3389 skipped=…
A desktop that doesn't fill the window is a VNC server that keeps its
own size, which occamyd logs as
WARN vnc: the server prohibits resizing the screen or
WARN vnc: the server did not resize the screen. The web client then
scales the desktop to fit.
The clipboard doesn't arrive
The web client's Clipboard panel says whether the connection, the browser or the remote held the text back, as Copy and paste describes for users. These are the cases that the configuration or the remote causes:
| What happens | The log says | Why |
|---|---|---|
| Text never leaves the remote, or never reaches it | Nothing | The connection sets disable_copy or disable_paste (Close the clipboard) |
| A VNC server's long text arrives cut | WARN vnc: cut text truncated or WARN vnc: extended clipboard text truncated |
occamyd cuts a VNC server's text to 4 MiB |
| Text sent to an RDP server waits | WARN rdp: the server's clipboard has not taken the owner's text, which waits for it, after a minute |
The server runs its clipboard in a process that starts when a user logs on, so the text waits until then. If it still waits after logon, that process has probably stopped, and opening the session again may start it |
Characters such as 日本 arrive on a VNC server as ? |
Nothing | The server doesn't speak the Extended Clipboard extension, as x11vnc doesn't, and takes Latin-1 only. TigerVNC takes UTF-8 |
Memory or goroutines keep growing
Turn on the debug listener and watch the number of goroutines and the heap over a day:
curl -s localhost:6060/debug/vars | jq '{goroutines, fds, heap: .memstats.HeapInuse}'
An idle occamyd runs a handful of goroutines. Each session adds
several, for its backend and each viewer's stream, and each idle
keep-alive connection adds one. Once every session has ended, the count
is back where it was, so a count that keeps growing is a leak, and
Goroutines shows which stack grows. Memory follows the
screens that viewers hold
(Limit the memory that viewers hold).
The log
occamyd writes its log to standard error. This is the start of an
occamyd whose user alice mistyped her password once, then opened a
connection to a VNC server that was down:
2026/11/04 20:12:56 server.go:135: occamy: serving API v1 at http://127.0.0.1:5636
2026/11/04 20:12:56 server.go:137: occamy: serving expvar and pprof at http://127.0.0.1:6060/debug/
2026/11/04 20:12:57 middleware.go:41: occamy: "GET" "/healthz" 200 108µs 127.0.0.1:54599
2026/11/04 20:13:01 signin.go:120: occamy: sign-in failed from 127.0.0.1:54996
2026/11/04 20:13:01 middleware.go:41: occamy: "POST" "/api/v1/auth/token" 401 187.813ms 127.0.0.1:54996
2026/11/04 20:13:01 signin.go:131: occamy: user "alice" signed in, idp local
2026/11/04 20:13:01 middleware.go:41: occamy: "POST" "/api/v1/auth/token" 200 194.18ms 127.0.0.1:55014
2026/11/04 20:13:05 sessions.go:406: occamy: session iveQDlpIpFSzK2wLN6Fr7Q: user "alice" opened connection "build-box" through vnc
2026/11/04 20:13:05 middleware.go:41: occamy: "POST" "/api/v1/sessions" 201 500µs 127.0.0.1:55212
2026/11/04 20:13:05 session.go:483: occamy: INFO session ended session=iveQDlpIpFSzK2wLN6Fr7Q reason=failed err="vnc: dial tcp 10.0.4.20:5900: connect: connection refused"
Each line has the same parts:
| Part | In the last line | What it is |
|---|---|---|
| Date and time | 2026/11/04 20:13:05 |
The host's local time, to the second |
| Source | session.go:483 |
The file and line of occamyd's code that wrote it, for a bug report |
| Prefix | occamy: |
The same on every line |
| Level | INFO |
INFO, WARN or ERROR, on lines from sessions, streams and backends only |
| Message | session ended |
What happened |
| Details | session=… reason=failed err="…" |
key=value pairs, with a value in quotes when it has spaces |
occamyd writes no debug lines, and you can't change the level. The
lines about what a user did with a session, such as opened and
shared, start session <id>:, and the lines of the session itself,
its viewers' streams and its connection to the remote, such as
session ended, viewer dropped and WARN vnc: …, carry
session=<id>.
What the lines say
| Line | When |
|---|---|
serving API v1 at http://[::]:5636 |
At start, with the public listener's address |
serving expvar and pprof at http://127.0.0.1:6060/debug/ |
At start, when the debug listener is on |
debug listener off: OCCAMY_DEBUG_ADDRESS, which debug.address_env names, is unset or empty |
At start, when debug.address_env names a variable without an address |
TCP congestion control: bbr |
At start, on Linux. With congestion_control: system, it ends , the kernel's choice |
OIDC provider https://idp.example.com discovered |
With OIDC, once the provider has answered |
"GET" "/api/v1/connections" 200 1.234ms 10.0.0.7:51544 |
After each request, on either listener: the method, the path, the status, the duration and the client's address |
user "alice" signed in, idp local |
A sign-in with a password. Through OIDC, the line ends idp oidc |
sign-in failed from 10.0.0.7:51544 |
A wrong user name or password |
OIDC sign-in failed from 10.0.0.7:51544: … |
An OIDC sign-in failed, with the reason |
session <id>: user "alice" opened connection "build-box" through rdp |
A session opened. An ad-hoc target shows as ad-hoc target "vnc://10.0.0.5:5900" |
user "alice" opening connection "build-box": … |
A session couldn't open, with the reason |
session <id>: shared with role viewer for 1h0m0s |
The owner made a share link |
session <id>: closed by its owner |
The owner ended the session |
INFO session ended session=<id> reason=… err=… |
A session ended, for one of the reasons below |
stream refused from 10.0.0.7:51544: origin not allowed |
A stream was refused before it joined a session. The other reasons are invalid hello and unsupported protocol version |
session <id>: viewer 2: the stream ended: … |
A viewer's stream failed while the session runs on |
INFO viewer dropped session=<id> viewer=2 err=… |
A viewer acknowledged no frame for streams.viewer_timeout, and occamyd disconnected it |
INFO client closed session=<id> code=… reason=… |
A client closed its stream because of a fault, such as a tile it couldn't decode |
INFO rdp: the server ended the session session=<id> addr=… reason=… |
An RDP server ended the session, with its reason |
ERROR session panicked session=<id> |
occamyd failed on its own. The line has the stack, for a bug report |
The request line never holds the query string, the headers or the body,
so tokens and passwords stay out of the log. The client's address is
the one occamyd sees, which behind a reverse proxy is the proxy's. A
stream's request line appears when the stream ends, with the status
101 and the whole time it was open.
A session ends for one of these reasons:
reason= |
Why |
|---|---|
closed |
The owner ended it |
"owner left" |
The owner left and didn't come back within a minute |
idle |
Nobody gave input for 30 minutes |
"remote ended" |
The remote ended it, as when its user logs out |
failed |
The backend couldn't connect, or lost the remote. err= says why |
shutdown |
occamyd is stopping |
"internal error" |
occamyd failed on its own. An ERROR session panicked line before it has the stack |
When occamyd stops on SIGTERM, it logs
received terminated: shutting down; a second signal stops occamyd at once
and shutting down: draining requests for up to 5s, then
occamyd has stopped. On SIGINT, the first line says interrupt
in place of terminated. A request still running after the drain, such
as a long CPU profile, is cut with a warning, and so are streams still
open 5 seconds after that.
Warnings at start
| Warning | What to do |
|---|---|
created a new signing key in …; tokens signed with any earlier key no longer verify |
Expected at the first start. On a server that has run before, the key's volume is missing, and everyone has to sign in again. Keep the key on a persistent volume |
the debug listener on … serves profiles and the command line without authentication beyond the loopback interface |
Move debug.address to localhost. In a container, publish the port on the host's loopback interface only, and the warning is expected |
congestion_control bbr: the kernel has not loaded it: load its module, tcp_bbr; connections use cubic |
Load the module, with sudo modprobe tcp_bbr, on the host or the node (TCP congestion control) |
congestion_control bbr: the kernel allows it only to privileged processes: … |
Add it to the net.ipv4.tcp_allowed_congestion_control sysctl |
web_client: …; /static/ serves no web client until it is built there (make client) |
Build the web client into that directory, or point web_client at the dist directory of its release archive |
the static users' password hashes have different bcrypt costs, … |
Hash every user's password at the cost that the warning names. Otherwise the time a sign-in takes tells which users exist |
connection "…": security: tls may send the password inside TLS whose certificate tls.insecure_skip_verify accepts unchecked, … |
Pin the server's certificate with tls.pins in place of insecure_skip_verify |
OIDC discovery at … failed, retried on the next sign-in after 10s: … |
occamyd can't reach the provider, and OIDC sign-ins fail until it can. Check auth.oidc.issuer and the network to it |
adhoc_allowlist: not every address of occamyd's listeners is known, so a range may open it: … |
occamyd couldn't resolve the host of listen or debug.address, so an ad-hoc target in a range of adhoc_allowlist may reach occamyd itself. Use IP addresses there, or keep them out of the ranges |
Warnings during a session
| Warning | What it means |
|---|---|
WARN ssh: accepting an unverified host key |
The connection sets insecure_ignore_host_key, or the user accepted any host key for an ad-hoc target. Pin the logged fingerprint in host_keys |
WARN vnc: accepting an unverified certificate, and the same for rdp and kubernetes |
The connection sets tls.insecure_skip_verify. Pin the logged fingerprint in tls.pins |
WARN vnc: logged in with Apple Remote Desktop authentication, … |
The session runs unencrypted, as ard: true allows |
WARN rdp: the server draws with GFX that the client does not decode yet, … |
Parts of the screen may stay missing or stale, as on a Windows host. Set disable_gfx: true on the connection |
WARN rdp: the server's clipboard has not taken the owner's text, … |
The RDP server's clipboard doesn't answer. The text waits until it does |
WARN vnc: the server prohibits resizing the screen; … |
The VNC server keeps its own screen size |
WARN tls: the certificate changed but doesn't load; keeping the one before |
tls.cert or tls.key changed, and the pair doesn't load, as while a renewal has replaced one file and not yet the other. occamyd serves the certificate it had, and tries again when either file changes. INFO tls: the certificate reloaded follows once the pair loads |
WARN auth.trusted_issuers: the key of "…" changed but doesn't load; keeping the one before |
The issuer's public_key_file changed, and doesn't hold an Ed25519 public key in PKIX PEM. Tokens are checked with the key from before |
The health check
occamyd answers GET /healthz on its public listener, without a
token, while it serves requests:
curl -s http://localhost:5636/healthz # {"status":"ok"}
It says nothing about whether the remotes can be reached. The image has
no shell and no curl, so probe it from outside, from a load balancer
or as a Kubernetes probe does:
livenessProbe:
  httpGet:
    path: /healthz
    port: 5636
When occamyd serves TLS itself, add scheme: HTTPS. Each check adds
a request line to the log.
The debug listener
occamyd serves Go's runtime statistics and profiles on a second
listener, on a port of its own, which you turn on with debug.address:
debug:
  address: localhost:6060
Important
The debug listener has no authentication, and its profiles and
command line describe your server. Keep it on the loopback interface;
occamyd warns at start when it isn't.
To turn the listener on without editing the file, name an environment variable that holds the address instead, which leaves the listener off while it's unset or empty. The debug listener's keys give the rules for both:
debug:
  address_env: OCCAMY_DEBUG_ADDRESS
In a container, a published port reaches the container's own address,
not its loopback interface, so listen on 0.0.0.0:6060 there, and
publish the port on the host's loopback interface only, as in
-p 127.0.0.1:6060:6060. In Kubernetes, keep localhost:6060, and
reach it with kubectl port-forward. The demo stack of
Try Occamy serves its debug listener at localhost:5638
after make run OCCAMY_DEBUG=1.
/debug/vars
/debug/vars returns one JSON object:
| Field | What it holds |
|---|---|
cmdline |
occamyd's command line |
memstats |
Go's memory statistics, such as HeapInuse, Sys and NumGC |
goroutines |
The number of goroutines |
fds |
The open file descriptors on Linux and macOS, or -1 where occamyd can't count them |
tcp_congestion |
The TCP congestion control of the public listener's connections, such as bbr, or empty where occamyd can't tell, as off Linux |
To watch the numbers that matter most:
curl -s localhost:6060/debug/vars | jq '{goroutines, fds, tcp_congestion, heap: .memstats.HeapInuse}'
Profiling occamyd
The debug listener serves Go's profiles under /debug/pprof/, and the
HTTP API lists each route:
| Route | What it shows |
|---|---|
/debug/pprof/ |
An index of the profiles |
/debug/pprof/goroutine |
Every goroutine and its stack |
/debug/pprof/heap |
Memory in use, by allocation site |
/debug/pprof/allocs |
Every allocation since start |
/debug/pprof/profile |
CPU, sampled for seconds, 30 by default |
/debug/pprof/trace |
An execution trace, for seconds, 1 by default |
/debug/pprof/threadcreate |
The stacks that created OS threads |
/debug/pprof/block, /debug/pprof/mutex |
Blocking and lock contention. Both are empty, since occamyd doesn't record them |
Goroutines
# The first line is the total, then one entry for each distinct stack.
curl -s 'localhost:6060/debug/pprof/goroutine?debug=1' | head -1
# Every goroutine with its full stack and how long it has waited.
curl -s 'localhost:6060/debug/pprof/goroutine?debug=2'
?debug=1 groups the goroutines by stack, so when the count grows, the
stack whose count grows is the one to look at.
CPU and memory
# Sample the CPU for 30 s while sessions run, then open pprof's web UI.
go tool pprof -http=:8080 'http://localhost:6060/debug/pprof/profile?seconds=30'
# Memory in use now.
go tool pprof -http=:8080 http://localhost:6060/debug/pprof/heap
# A 5 s execution trace: scheduling, network waits and garbage collection.
curl -o trace.out 'localhost:6060/debug/pprof/trace?seconds=5'
go tool trace trace.out
Threads
Go runs goroutines on a small pool of OS threads, so the number of
threads doesn't follow the number of sessions. threadcreate?debug=1
counts the threads created since start, which the runtime seldom ends.
For the number running now, run
grep Threads /proc/$(pidof occamyd)/status on Linux, or read the
PIDS column of podman stats or docker stats.
The pressure test and the soak read the debug listener to check that
occamyd doesn't leak, as Development
describes.