Benchmarks
Occamy is measured against Guacamole on the same remote desktops and terminals, over the same emulated networks, on one host. This page shows the results, how to read them, and how they were measured, so that you can judge them for your own use.
Occamy against Guacamole
A harness plays the user and records what each server sends and when each effect shows. It ran five scenarios, each six times for each server in random order, with no delay added and over a link of 50 ms round trip and 20 Mbit/s:
| Scenario | What the harness does | What it measures |
|---|---|---|
| Typing over SSH | Types 200 characters into a shell, 10 a second | How long each character takes to show |
| Long output over SSH | Runs seq 1 100000, which prints 100,000 lines |
How long until the last line shows |
| Key press, over VNC and RDP | Presses keys on a desktop where nothing else changes, 10 a second | How long each key's effect takes to show |
| Key during motion, over VNC and RDP | Presses keys while the whole screen animates at 30 frames a second, as a video or a game would | How long each key's effect takes to show |
| Full-screen photo, over VNC and RDP | Shows a photograph that fills the screen | How much data the photograph takes to reach the client |
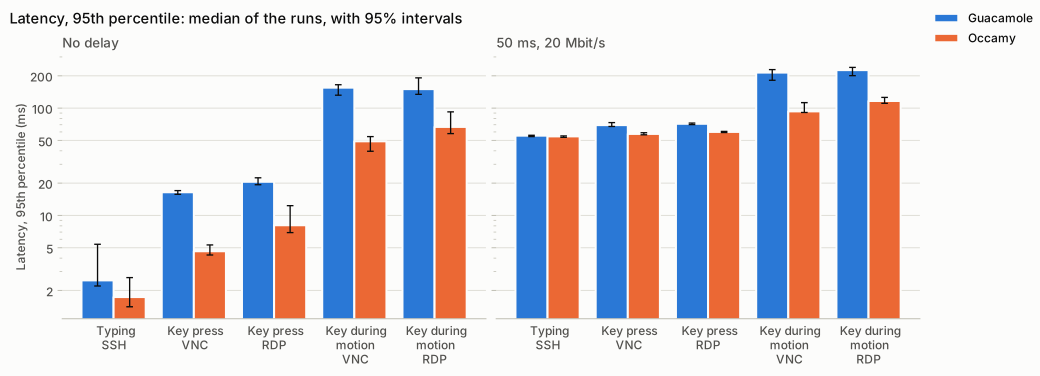
A key's latency runs to the first frame that shows its effect (The metrics). The tables give its 95th percentile: 95 of every 100 keys show at least this soon, so it describes the slow keys that you notice, not the typical one.
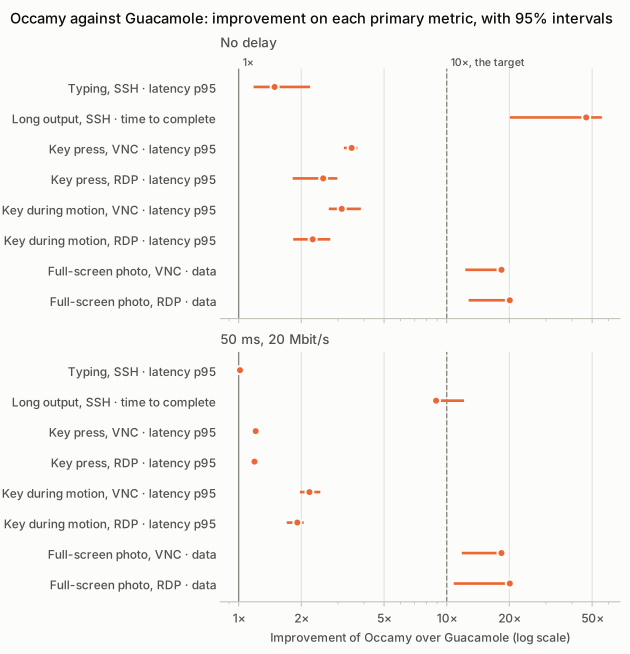
Each dot shows Occamy's improvement over Guacamole in one scenario, Guacamole's latency, time or data divided by Occamy's, so that 3× means a third of what Guacamole needs. Its line is the 95% interval, in which the true improvement lies with 95% confidence. Right of the solid line at 1× is better than Guacamole, and the dashed line at 10× is Occamy's target.
A key's latency, 95th percentile, in ms
| Scenario | Network | Guacamole | Occamy | Improvement | p (Holm) |
|---|---|---|---|---|---|
| Typing, SSH | No delay | 2.48 [2.20, 5.39] | 1.73 [1.41, 2.63] | 1.49× [1.18, 2.21] | 0.0519 |
| Typing, SSH | 50 ms, 20 Mbit/s | 55.4 [54.3, 55.8] | 54.5 [53.4, 55.1] | 1.02× [0.999, 1.03] | 0.0649 |
| Key press, VNC | No delay | 16.4 [15.7, 17.0] | 4.64 [4.28, 5.31] | 3.49× [3.21, 3.73] | 0.0346 |
| Key press, VNC | 50 ms, 20 Mbit/s | 69.4 [67.5, 73.3] | 57.5 [56.4, 59.0] | 1.21× [1.18, 1.24] | 0.0346 |
| Key press, RDP | No delay | 20.6 [19.3, 22.4] | 8.10 [6.92, 12.3] | 2.55× [1.82, 2.98] | 0.0346 |
| Key press, RDP | 50 ms, 20 Mbit/s | 71.4 [70.2, 72.6] | 60.0 [59.3, 60.7] | 1.19× [1.18, 1.21] | 0.0346 |
| Key during motion, VNC | No delay | 155 [132, 165] | 49.0 [39.6, 54.3] | 3.13× [2.71, 3.87] | 0.0346 |
| Key during motion, VNC | 50 ms, 20 Mbit/s | 214 [182, 229] | 93.2 [91.1, 113] | 2.19× [1.97, 2.47] | 0.0346 |
| Key during motion, RDP | No delay | 150 [135, 191] | 66.8 [57.9, 92.3] | 2.27× [1.83, 2.76] | 0.0346 |
| Key during motion, RDP | 50 ms, 20 Mbit/s | 226 [201, 240] | 117 [111, 126] | 1.91× [1.70, 2.05] | 0.0346 |
Long output over SSH, time until it has all shown, in ms
| Network | Guacamole | Occamy | Improvement | p (Holm) |
|---|---|---|---|---|
| No delay | 930 [864, 978] | 19.7 [16.6, 48.6] | 46.8× [20.1, 55.7] | 0.0346 |
| 50 ms, 20 Mbit/s | 951 [917, 1,316] | 107 [105, 109] | 8.89× [8.54, 12.1] | 0.0346 |
A full-screen photo, data to the client, in KiB
| Protocol | Network | Guacamole | Occamy | Improvement | p (Holm) |
|---|---|---|---|---|---|
| VNC | No delay | 2,235 [1,497, 2,235] | 122 [122, 122] | 18.3× [12.3, 18.3] | 0.0346 |
| VNC | 50 ms, 20 Mbit/s | 2,235 [1,441, 2,235] | 122 [122, 122] | 18.3× [11.8, 18.3] | 0.0346 |
| RDP | No delay | 2,175 [1,379, 2,175] | 108 [108, 115] | 20.1× [12.7, 20.1] | 0.0346 |
| RDP | 50 ms, 20 Mbit/s | 2,175 [1,169, 2,175] | 108 [108, 111] | 20.1× [10.8, 20.1] | 0.0346 |
Each value is the median of 6 runs, with its 95% interval in brackets. p (Holm) is the probability of a difference at least this large if the two servers were the same, corrected for the 16 comparisons with Holm's method. Below 0.05, a difference is significant, too large to be chance, as 14 of the 16 are. The two that aren't are typing over SSH, where both servers show a character within 2.5 ms with no delay, and within 56 ms at 50 ms. With 6 runs a side, the exact test's smallest p-value is 0.0022, which the correction raises to 0.0346.
What the results show
- A key shows sooner, most during full-screen motion: within 49 ms over VNC and 67 ms over RDP, where Guacamole takes 155 and 150 ms. With a 50 ms round trip, the network takes most of the time.
- Long output finishes at once: in 20 ms instead of 930 ms, because Occamy sends the terminal's last screen instead of every line that scrolled past.
- A photograph takes a twentieth of the data: 108 to 122 KiB instead of 2.1 to 2.2 MiB, because Occamy sends photographs as WebP or JPEG, where Guacamole sent most of this one as PNG.
- Motion costs less, in data and in the server's CPU:
| During full-screen motion | Guacamole | Occamy |
|---|---|---|
| Data to the client a frame | 46 to 66 KiB | 7.7 to 8.0 KiB |
| Server CPU a frame | 47 to 59 ms | 12 to 16 ms |
| Scene frames shown a second over VNC, of 30 | 25 | 29 |
| Scene frames shown a second over RDP, of 30, at the RDP server's own rate | about 24 | about 24 |
Codecs explains how Occamy encodes a frame, which is where most of these differences come from.
The full report has every metric with its interval and test, the memory and CPU each server used, and a figure for each metric. The results hold every run.
On a lossy link
A link that loses packets, such as Wi-Fi or a long mobile path, slows TCP down (What packet loss costs). So Occamy's server asks Linux for BBR, a congestion control that sets its rate from what the path carries rather than from the packets it loses (TCP congestion control).
A key during full-screen motion, latency at the 95th percentile, in ms
| Network and loss | Guacamole, VNC | Occamy, VNC | Guacamole, RDP | Occamy, RDP |
|---|---|---|---|---|
| 20 ms, 100 Mbit/s, no loss | 132 [123, 172] | 61.3 [58.0, 74.8] | 121 [117, 130] | 81.7 [79.8, 86.8] |
| 20 ms, 100 Mbit/s, 0.5% lost | 164 [152, 184] | 68.6 [65.8, 76.8] | 165 [153, 1,734] | 89.3 [81.7, 104] |
| 20 ms, 100 Mbit/s, 2% lost | 255 [209, 2,857] | 79.8 [72.4, 87.2] | 2,188 [264, 4,186] | 107 [91.3, 131] |
| 50 ms, 20 Mbit/s, no loss | 184 [169, 219] | 95.2 [92.7, 106] | 179 [172, 226] | 114 [111, 114] |
| 50 ms, 20 Mbit/s, 0.5% lost | 339 [276, 3,942] | 122 [94.8, 132] | 5,575 [362, 7,941] | 135 [127, 158] |
| 50 ms, 20 Mbit/s, 2% lost | 7,053, in 4 of 6 runs | 149 [136, 167] | not within 10 s in any run | 163 [150, 173] |
Guacamole needs 1.2 to 1.6 MiB a second for the scene, more than TCP carries at 50 ms with 2% lost. Guacamole's columns come from What packet loss costs and Occamy's from BBR against CUBIC: two runs on the same host and image, over the same emulated link.
Measurements behind Occamy's design
Occamy keeps a change to how it paces and carries frames only after measuring it against the alternative under the same conditions.
The frame window
Occamy's server lets as many frames go unacknowledged as cover the round trip, rather than a fixed two (see the frame window). This comparison measured a key during full-screen motion over VNC at 50 ms on 2026-11-02, with medians and 95% intervals:
| A window of two | A window from the path | |
|---|---|---|
| Scene frames shown a second, of 30 | 18.8 [15.9, 28.3] | 29.6 [29.2, 29.9] |
| Scene frames never shown | 37% [6, 47] | 1.5% [0.4, 2.8] |
| Gap between frames, 95th percentile | 76.7 ms [64.0, 98.9] | 49.1 ms [47.8, 52.8] |
| Latency, 95th percentile | 119 ms [116, 133] | 95.7 ms [92.9, 99.4] |
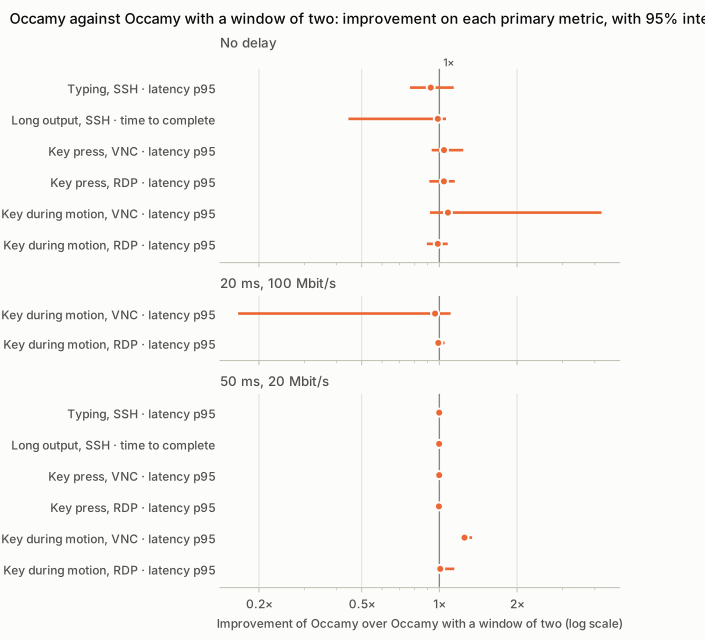
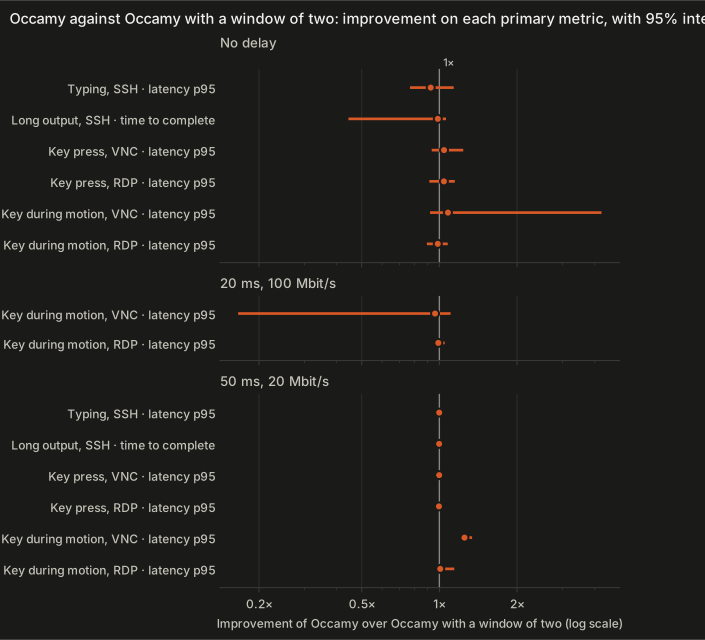
The window was the limit only where the round trip is long and the screen changes often: with no delay and at 20 ms, two frames already covered the round trip. Over RDP, the server's own rate of about 24 frames a second holds, but the frames come more evenly: 48 ms apart at the 95th percentile instead of 63. The full report has every metric.
What packet loss costs
This comparison measured both servers over a link that loses 0.5% or 2% of the packets to the client, with Occamy's server on CUBIC, the congestion control that Linux uses by default.
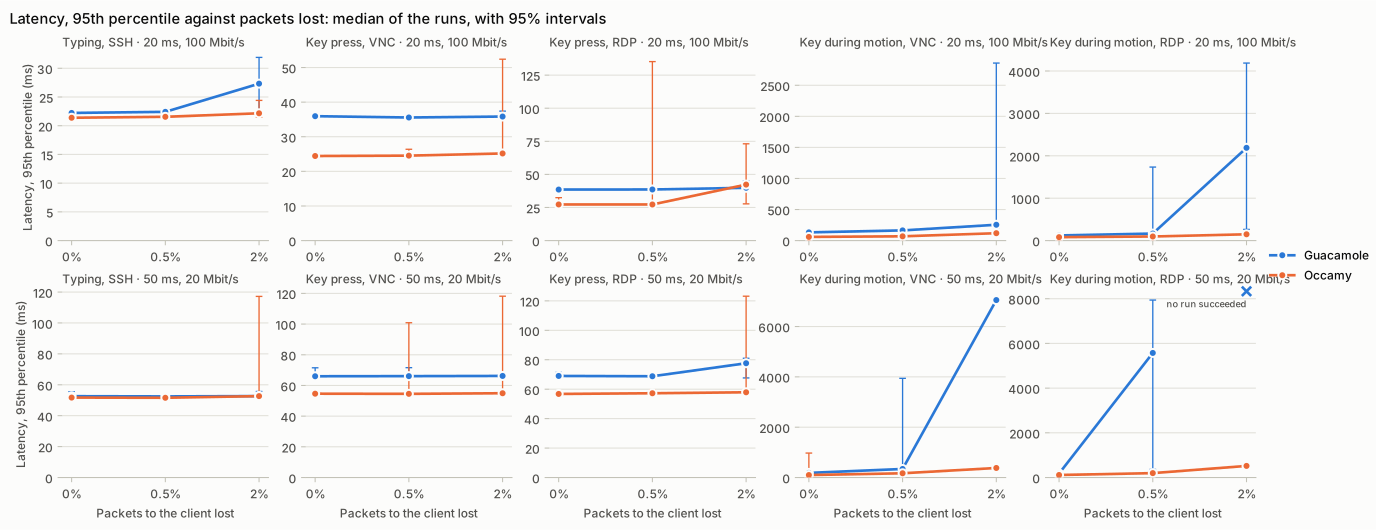
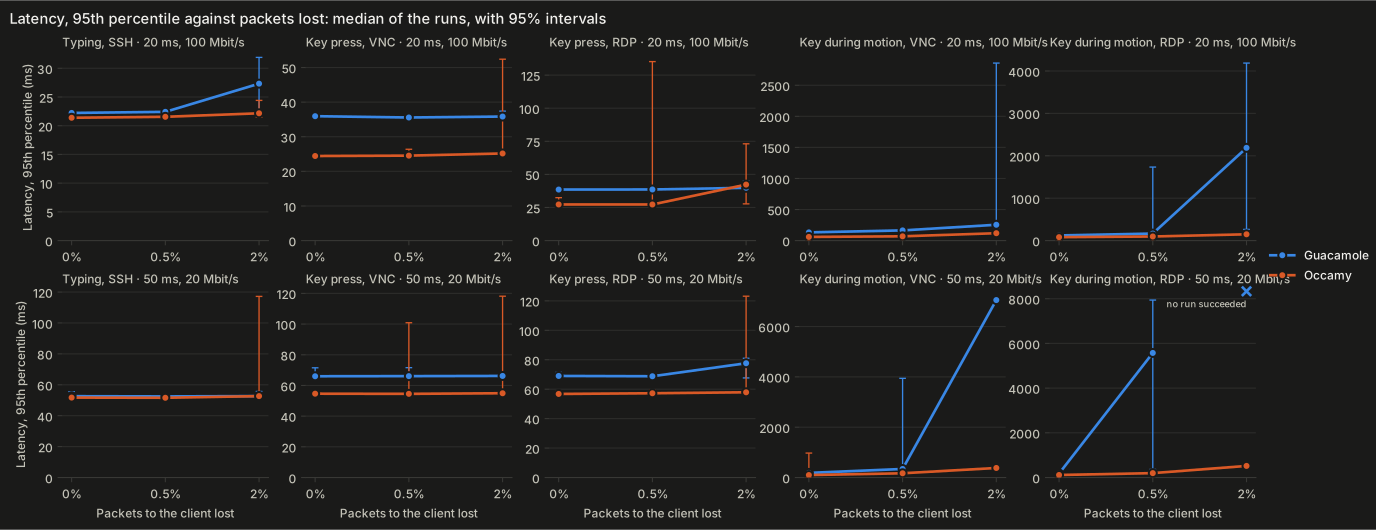
- Loss costs a session twice. A lost packet holds back every frame behind it until it's sent again, for up to three round trips. And TCP reads a random loss as congestion: with CUBIC, its rate falls to about 1.22 · MSS / (RTT · √p). At 50 ms with 2% lost, that's 245 KiB a second, less than the motion scene's 350 to 420. Occamy then showed only 16 of its 30 frames a second, and a key waited 5 to 8 round trips.
- Guacamole needs more than the link carries in every lossy case, so its frames queue and a key waits behind them: 2.2 s over RDP at 20 ms with 2% lost, and 5.6 s at 50 ms with 0.5% lost.
- Typing and a key on a still desktop send a packet or two a key, so the 95th percentile hardly moves. The few keys whose packet is lost wait three round trips and 200 ms, for Linux's tail loss probe, whatever the congestion control.
With 6 runs a side, no difference here can be significant after the correction over 39 tests, so these conclusions rest on the differences and their intervals. The full report has every metric.
BBR against CUBIC
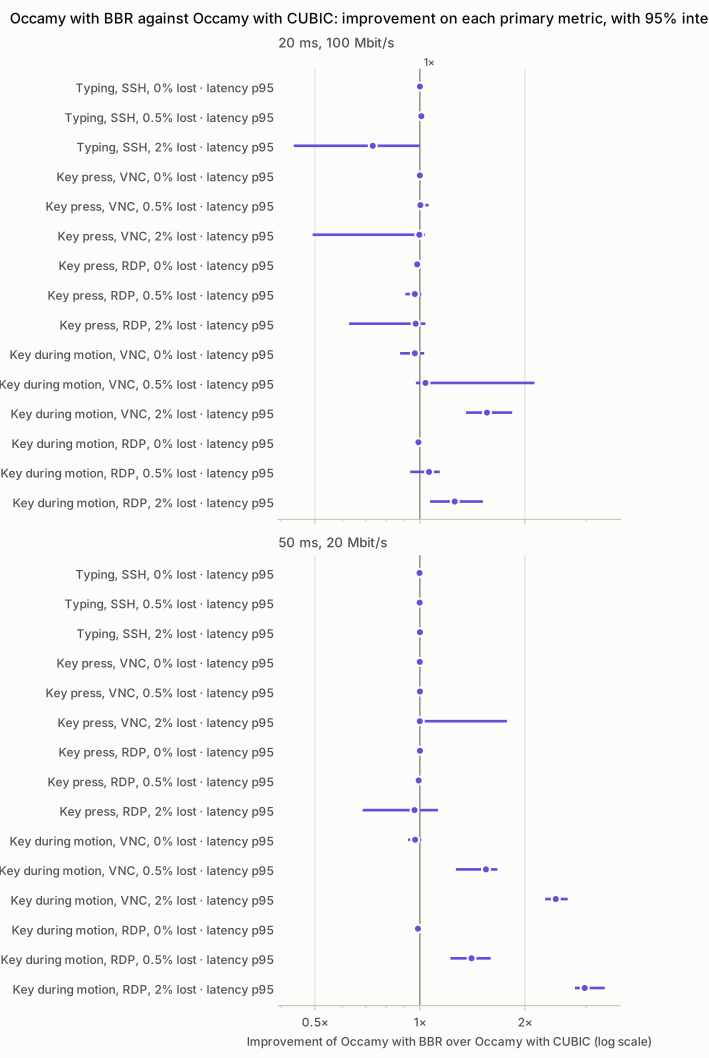
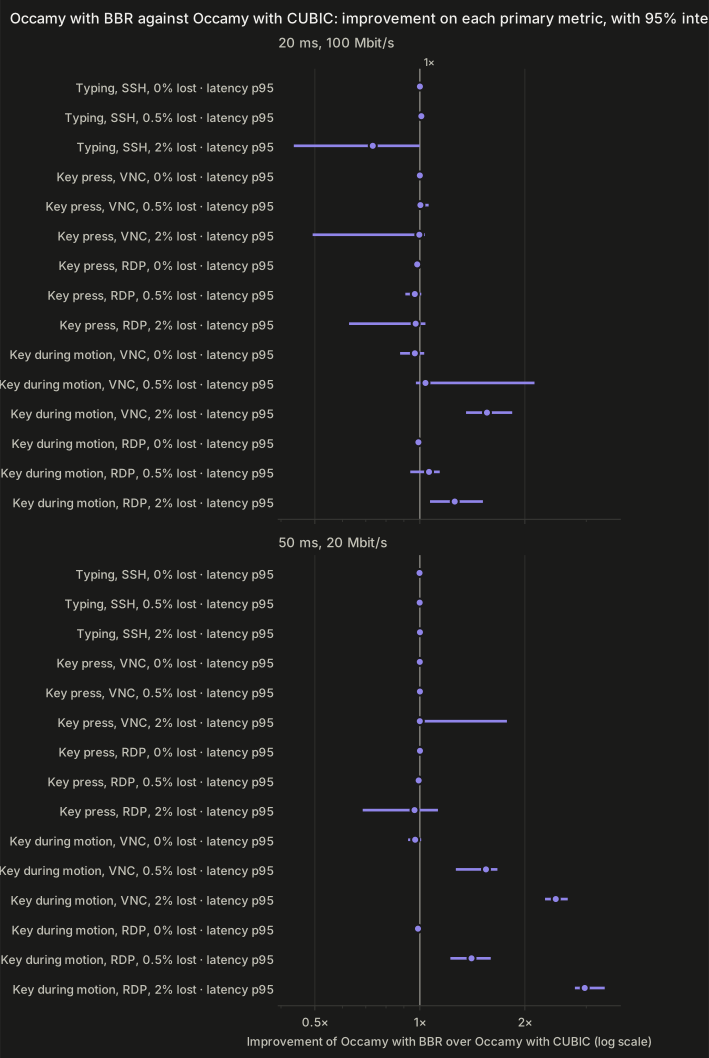
The same lossy link, with Occamy's server on CUBIC and on BBR:
| At 50 ms with 2% lost | CUBIC | BBR | Improvement |
|---|---|---|---|
| A key during motion over VNC, 95th percentile | 360 ms | 149 ms | 2.45× |
| A key during motion over RDP, 95th percentile | 471 ms | 163 ms | 2.97× |
| Scene frames shown a second over VNC, of 30 | 16.4 | 27.6 | |
| Server CPU a frame over VNC | 24.9 ms | 19.6 ms |
With BBR, loss costs a key about one round trip, and the frame rate holds: over RDP, you see 24.4 frames a second, the server's rate without loss. Without loss, nothing changes, and neither does typing or a key on a still desktop. Five of the 30 differences are significant after Holm's correction, all of them for a key during motion with loss. The full report has every metric.
How Occamy is measured
The setup
make bench starts Occamy's demo stack on one host, with a bench
desktop in place of the demo's VNC and RDP servers, and Guacamole's
guacd beside occamyd. A harness then connects to each server through
an emulated network:
flowchart LR
  H["<b>Harness</b><br/>plays the user and<br/>decodes every frame"] <--> N["<b>Emulated network</b><br/>adds the round trip,<br/>limits the bandwidth"]
  N <--> S["<b>Server under test</b><br/>Guacamole's guacd 1.6.0,<br/>or Occamy's occamyd"]
  S <--> R["<b>Remote</b><br/>an SSH server, or the<br/>bench desktop over<br/>VNC or RDP"]
The harness behaves as each server's own client does:
| Against Guacamole | Against Occamy | |
|---|---|---|
| It speaks | The Guacamole protocol to guacd, as Guacamole's web application does | Protocol v1 to occamyd, through the Go client |
| With | guacd's defaults, and ignore-cert for RDP |
The web client's codecs: deflate, WebP, JPEG, scaled and raw |
| For each frame | It answers the sync at once, as guacamole-common-js does, and sends a nop every 5 seconds |
It acknowledges a desktop's frame at the next refresh of a 60 Hz screen, and a terminal's at once, as the web client does |
Both decode every image into a framebuffer, and each scenario runs on a fresh session.
The bench desktop (docker/bench/desktop) runs a scene program
(bench/scene) with no window manager, which covers the screen with
one window and draws from fixed seeds, so every run sees the same
pixels. Function keys switch scenes: idle, the probe, a scroll, a drag,
full-screen motion and a photograph. The VNC server is x11vnc on Xvfb,
tuned to answer a key in 2.9 ms at the median and 3.5 ms at the 95th
percentile, and the RDP server is xrdp with xorgxrdp, as Debian
configures it. The terminal is 99 × 39 cells, the size of guacd's at
1024 × 768 pixels.
The results on this page were measured on 2026-11-03 on an Apple M5
Pro with 18 CPUs and podman 6.0.2, against the guacamole/guacd:1.6.0
image.
Scenarios
The plans, the harness's flags and the results files name each scenario by a code:
| Code | Name | Protocols | What happens | Primary metric |
|---|---|---|---|---|
| T1 | Typing | SSH | 200 characters, 10 a second, into an idle shell | Latency |
| T2 | Long output | SSH | seq 1 100000, then an end marker |
Time until the marker shows |
| T3 | top | SSH | top -d 0.5 for 30 s |
Data per second |
| G1 | Still desktop | VNC, RDP | Nothing changes for 30 s | Data per second |
| G2 | Key press | VNC, RDP | Keys, 10 a second on average, on a still desktop | Latency |
| G3 | Scrolling text | VNC, RDP | A page scrolls a line every 16 ms for 10 s | Data per frame |
| G4 | Dragging a window | VNC, RDP | A 400 × 300 window dragged at 60 Hz for 10 s | Data per frame |
| G5 | Key during motion | VNC, RDP | Full-screen motion at 30 frames a second, with keys | Latency |
| G6 | Full-screen photo | VNC, RDP | One photograph fills the screen | Data to the client |
| G7 | Connecting | all | Connect, until the remote's known content shows | Time to the first frame |
Each scenario's primary metric is the one its comparison is judged on, fixed before any data were collected. A latency's primary metric is its 95th percentile.
Networks
A proxy inside the harness carries every connection. It adds half the round trip in each direction, sends at the bandwidth, and queues up to twice the bandwidth-delay product.
| Code | Round trip | Bandwidth |
|---|---|---|
| N0 | none added | unlimited |
| N1 | 20 ms | 100 Mbit/s |
| N2 | 50 ms | 20 Mbit/s |
| N3 | 100 ms | 5 Mbit/s |
| N4 | 250 ms | 1 Mbit/s |
A proxy has no packets to lose, so a study of loss emulates the whole
link in the kernel instead, with tc netem in the network namespace of
the server under test, and loses packets on the way to the client only.
The metrics
Latency runs from the moment the harness writes a key to the first frame that shows its effect:
sequenceDiagram
  participant H as Harness
  participant S as Server under test
  participant D as Bench desktop
  Note over H: Writes the key for "a":<br/>the latency starts
  H->>S: Key "a"
  S->>D: Key "a"
  Note over D: Paints a 32 × 32 swatch<br/>in the colour of "a"
  D->>S: Screen update
  S->>H: Frame
  Note over H: Decodes the frame. The swatch's<br/>centre shows the colour of "a":<br/>the latency ends
Each letter paints its swatch in a colour of its own, so the harness knows which key a frame answers. In a shell, which draws nothing else while it's idle, a typed character's latency ends at the first frame after the key. Keys come 100 ms apart on average, each moved by up to one 60 Hz period, so that they meet the screen's refresh at every phase. Typing's keys stay exactly 100 ms apart.
| Metric | What it counts |
|---|---|
| Frames shown a second | The scene's frames that reached the client whole. Each frame of the scroll, the drag and the motion carries its number in the margin, and the harness counts the numbers it was shown. A server may split a frame of the scene or merge several, so this counts what you would see, not what the server sent. |
| Scene frames never shown | The share of the scene's frames whose number the client never showed. |
| Gap between frames | The time between consecutive frames shown. A scene shown whole and evenly at 30 frames a second has every gap at 33 ms. |
| Data | The TCP payload to the client. Occamy's includes the WebSocket's frame headers. |
| Server CPU | The CPU time of the container that serves the session: guacd's, including the process it forks for each connection, or occamyd's. |
| Client CPU | The harness's own CPU time, network emulation included, which every server pays alike. |
A sample that the stack doesn't answer fails rather than holding up the run: after 30 s to sign in and open the stream, 10 s for a key's effect, and 30 s for the long output's end marker.
Analysis
make bench-compare and the plans below measure in blocks: one
server under one network in one study. Every run measures every block
once, in an order drawn from the plan's seed and the run's number, so
that drift on the host favours neither server. Before each result, the
harness waits until the host's 1-minute load average is below 8, so
that one result's load doesn't spill into the next.
bench/report.py then computes, for each scenario, network and metric:
- the median of the runs, with an exact distribution-free 95% interval from order statistics;
- the improvement of one server over the other, the other's value divided by its own, inverted for a metric where higher is better, such as frames shown a second: the Hodges–Lehmann estimate of that ratio, with its exact 95% interval from the Mann–Whitney distribution;
- the p-value of the exact two-sided permutation test of the rank sum, over every split of the runs.
Holm's method corrects the primary metrics' p-values at 0.05; the other metrics are exploratory, and their p-values aren't corrected. The report also says whether any conclusion changes without the results that started while the host's load was above the gate.
Targets
Occamy's targets for its stable release are an improvement of 10× on each scenario's primary metric over Guacamole on the same network, a tenth of Guacamole's value, and a key's effect within 50 ms at the 95th percentile. Where something outside Occamy makes a target impossible, such as the network's round trip or the remote server's own response time, the target is that limit plus a small margin. The full report marks each target that Occamy meets.
Run the benchmark
make bench
This builds occamyd's image from the working tree, starts the demo
stack with docker/docker-compose.bench.yaml on top, which adds guacd
on 127.0.0.1:4822, and runs every scenario against Guacamole
(guacd) and Occamy (v1-native) under N0, N1 and N2. The results go
to bench-results.json, and a table to standard output.
Important
Keep the host idle while the benchmark runs: a compile during a run
more than doubled some latencies. Use -runs 3, so that the table
shows the median of three runs and one disturbed run doesn't move it.
Server CPU needs podman, whose container statistics report CPU time;
with docker, pass -engine none. On a host that runs another stack,
give the bench its own name, ports and image:
| Variable | What it sets |
|---|---|
COMPOSE_PROJECT_NAME |
The stack's name |
OCCAMY_V1_PORT, OCCAMY_V1_CUBIC_PORT, GUACD_PORT, OCCAMY_V1_DEBUG_PORT, OCCAMY_V1_CUBIC_DEBUG_PORT |
Its ports |
OCCAMY_IMAGE |
The image that it builds |
Run a comparison
Each plan in bench/plans is one comparison:
| Command | Plan | What it measures | Time |
|---|---|---|---|
make bench-essential |
essential.yaml |
Guacamole against Occamy: T1, T2, and G2, G5 and G6 over VNC and RDP, under N0 and N2, 6 runs | about 1 hour |
make bench-compare |
compare.yaml |
Every scenario, network and series of the full comparison | several hours |
make bench-realtime-1 |
realtime-1.yaml |
The frame window | about 2 hours |
make bench-realtime-2 |
realtime-2.yaml |
Guacamole and Occamy with loss | about 3.5 hours |
make bench-realtime-3a |
realtime-3a.yaml |
CUBIC against BBR with loss, 8 runs | about 2 hours |
Each command writes its results as it goes. If the host's load stays
above the gate for 2 hours, it saves and exits, and the same command
resumes. BENCH_PLAN runs make bench-compare with another plan file.
A plan's keys sets how many keys a latency scenario presses, 200 by
default, and connects how many sessions G7 opens, 20 by default, or
none.
A study of loss needs the image that emulates the link,
occamy-bench-netem, which its target builds. The comparison of CUBIC
and BBR needs BBR in the host's kernel; on podman's virtual machine:
podman machine ssh sudo modprobe tcp_bbr
Each plan names the series it measures, the servers and settings under test. Committed results may also hold series that the harness no longer runs:
| Series | What it runs |
|---|---|
guacd |
Guacamole: guacd, through the Guacamole protocol |
v1-native |
Occamy, as it ships. In the committed results of the comparison of CUBIC and BBR, Occamy on CUBIC, Linux's default |
v1-native-w2 |
Occamy, with a client that offers a window of two frames |
v1-native-cubic |
Occamy on a second service that asks for CUBIC (docker/bench/occamy-v1-cubic.yaml) |
v1-native-nogfx |
Occamy over RDP without the graphics pipeline |
v1-native-bbr |
No longer run. In the committed results of the comparison of CUBIC and BBR, Occamy with BBR set for its network namespace |
occamy |
No longer run. In desktop-baseline.json and terminal-baseline.json, Occamy through guacd |
Make a report
make bench-essential-report    # bench-essential.json into docs/benchmarks/essential/
make bench-report              # bench-compare.json into docs/benchmarks/comparison/
make bench-realtime-1-report   # bench-realtime-1.json into docs/benchmarks/realtime/1/
make bench-realtime-2-report   # bench-realtime-2.json into docs/benchmarks/realtime/2/
make bench-realtime-3a-report  # bench-realtime-3a.json into docs/benchmarks/realtime/3a/
uv runs bench/report.py with its own
numpy, scipy and matplotlib. It writes:
| File | What it holds |
|---|---|
results.csv |
One row per run, cell and metric |
summary.csv |
The medians, with their intervals |
comparisons.csv |
The improvements and their p-values |
loss.csv |
In a study of loss, what each loss added |
report.md |
The report, with its tables and figures |
*.svg, *-dark.svg |
Each figure, in a light and a dark version |
To analyse a committed run again:
uv run bench/report.py docs/benchmarks/essential/bench-essential.json -o docs/benchmarks/essential
uv run bench/report_test.py checks the analysis on synthetic results
with known answers.
Flags
BENCH_FLAGS passes flags to the harness:
make bench BENCH_FLAGS="-scenarios T1 -net N1 -series v1-native"
| Flag | Default | Meaning |
|---|---|---|
-scenarios |
all |
Scenario codes, comma-separated |
-net |
N0,N1,N2 |
Networks |
-series |
guacd,v1-native |
Series, from the table above |
-runs |
1 |
How many times to run everything; the table shows medians |
-plan |
none | A plan file, in place of -series, -net, -scenarios and -runs |
-out |
bench-results.json |
Where the results go, saved as they come |
-resume |
off | Continue -out if it measures the same plan, keeping its complete blocks |
-max-load, -load-wait |
0, 2h |
Wait before each result until the 1-minute load is below -max-load, for up to -load-wait, then save and exit with status 2 |
-ack-hz |
60 |
The screen refresh on whose ticks Occamy's frames are acknowledged; 0 acknowledges at once, a diagnostic |
-quick |
off | A tenth of the samples and a sixth of the time, to check the setup |
-failfast |
off | Stop at the first error and exit non-zero |
-engine |
podman |
The container engine to read CPU time from, or none |
-project |
occamy |
The stack's compose project |
-v1, -v1-cubic, -guacd |
localhost:5637, localhost:5642, localhost:4822 |
Where the series' servers listen |
-runtime |
none | occamyd's debug listeners, as service=address pairs, to read its runtime from; make bench BENCH_RUNTIME=1 sets them |
-link-image |
occamy-bench-netem |
The image that emulates a study of loss's link (docker/bench/netem) |
CI runs a quick smoke test of every series on every push, with
-failfast, and compares no numbers, because shared runners are too
noisy.
Design
The specs give the benchmark's design, the targets and how each was derived, and each measurement behind the design: the benchmark, the comparison and real-time pacing and transport.